

Ashok Leyland stock prices had excellent run since the beginning of 2017. In early 2017, share prices were trading at 75, fast forward to march 2018, market price is 147. That’s almost 96% gain in less than one and half years! Despite government budget and other black swan events in recent months, Share prices didn’t witness any major volatility or correction. Is there any strong Insider buying interest in the stock?
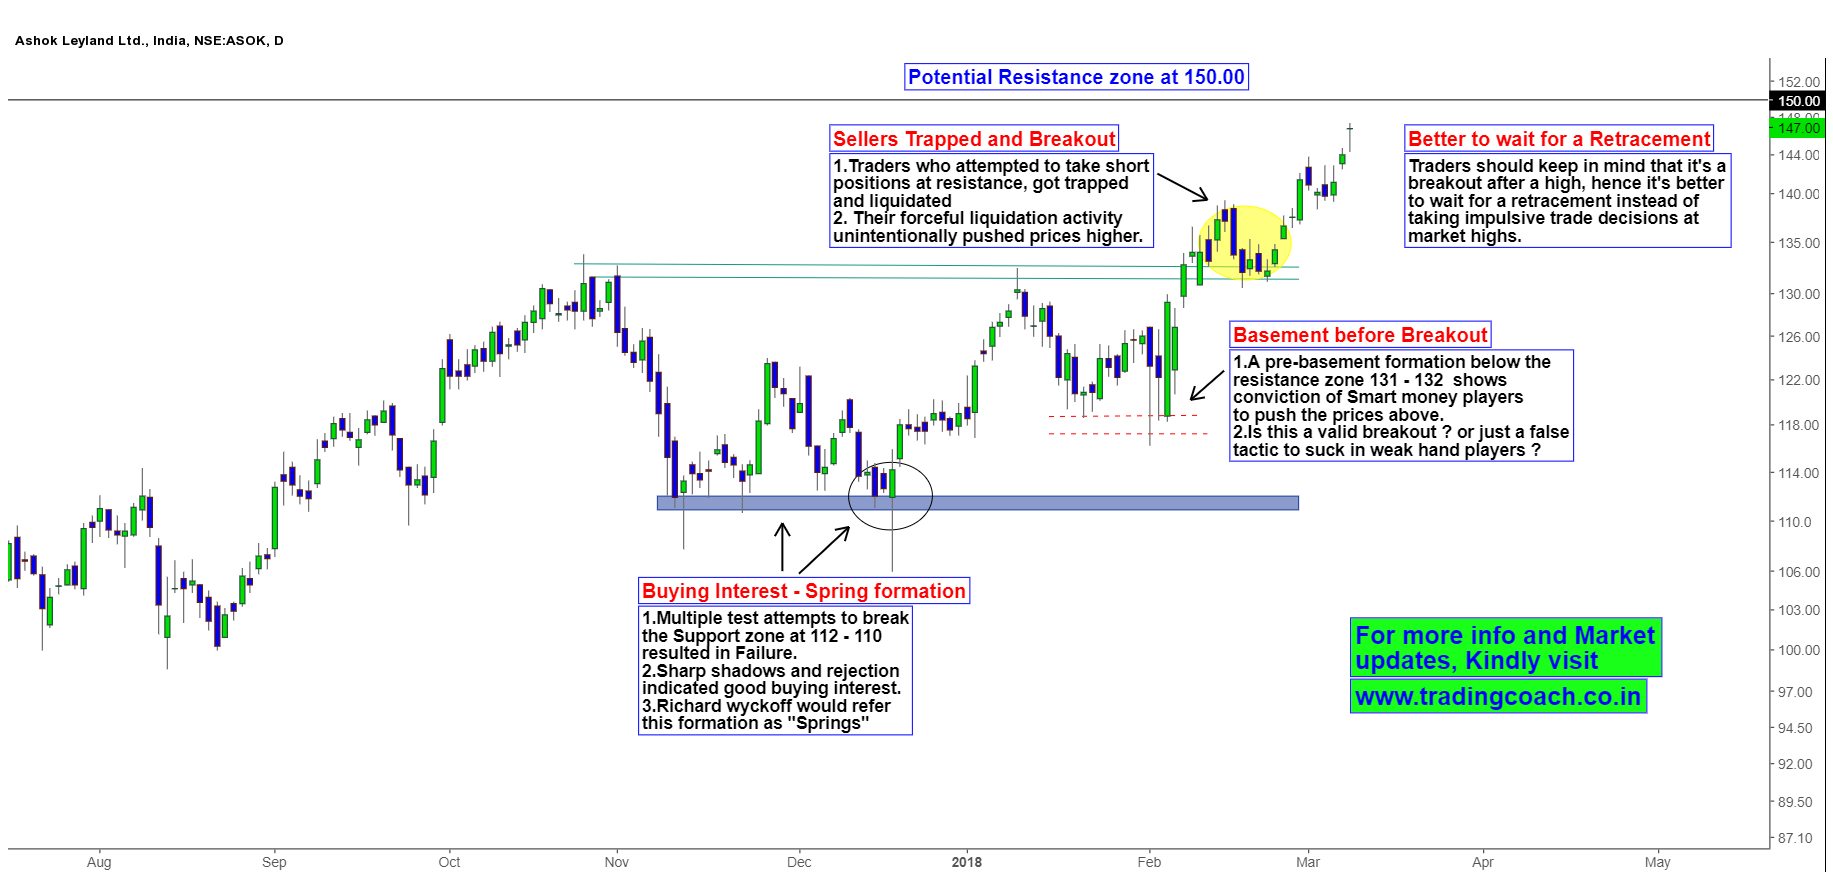
Ashok Leyland Price action on Daily Chart
Typically in a Bull market, investors and market participants can bid the share prices of certain stocks to unreasonable levels just based on perception of what they hear from media and company directors. Restructuring measures such as vehicle scrappage policy to trigger growth opportunity (not yet implemented in full extent!) and bolstering vision of launching one product every six months to capture new export markets have created a positive euphoria among investors. Whether it would happen or not is something we should wait and watch in coming quarters.
In the daily chart of Ashok Leyland, we see an upside breakout. Price action traders should watch this breakout; it may give some trading opportunities in coming weeks. One important thing is to keep in mind, it’s an upside breakout in a stock which is already trading at highs. Be cautious with the breakout, it’s better to wait for some retracement to check whether the breakout is really a valid one or not. Keep an eye on price action and trade accordingly.


