

Banking sector was in media spot light for the last few days, many stocks offered excellent opportunities for Short term traders. Price action in lower time frame was very volatile with multiple ups and downs, making it quite challenging to find trades. Nonetheless market movements offered good trading setups on both sides.
Axis Bank Price action on Daily chart
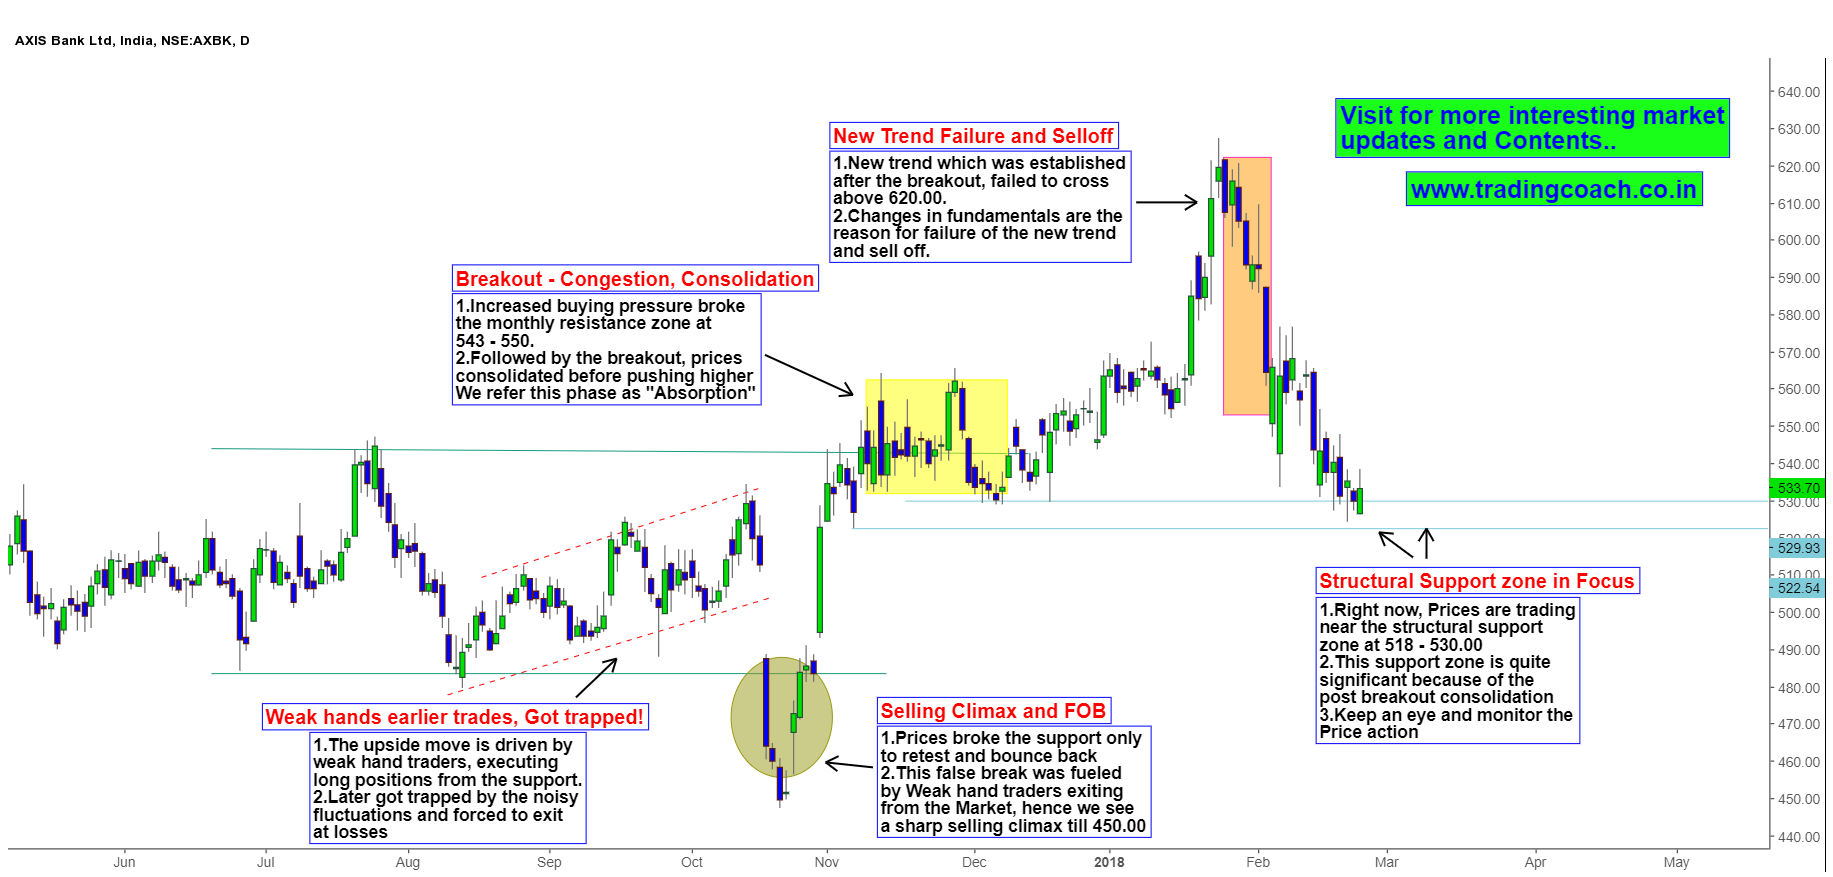
If you’re a Swing trader, Axis Bank is something that’s worth to keep an eye on. When we look at the Price action on Daily chart it somehow resembles a semi – Wyckoff cycle, except the structure of Uptrend failure. Changes in the fundamental market sentiment and Investors perception was the primary reason for this trend failure. (This specific instance is shows us how fundamentals can completely override Technical observations, as in this case newly established uptrend failed and prices reversed within a short period of time-after Investors got disappointed with 2018 budget!)
Right now prices are trading near the potential support zone at 518 – 530. Why we need to focus on this specific support zone? Its significance comes from the earlier Structural Breakout. In the period of Nov – Dec 2017, Prices broke out and consolidated right above this zone, indicating good buying interest at that time. So it’s essential to focus on the Price action at this support zone to check the strength of bulls. Monitor the developing market structure from this structural support zone; it can give some clues about market direction and potential swing trading price action setups.


