

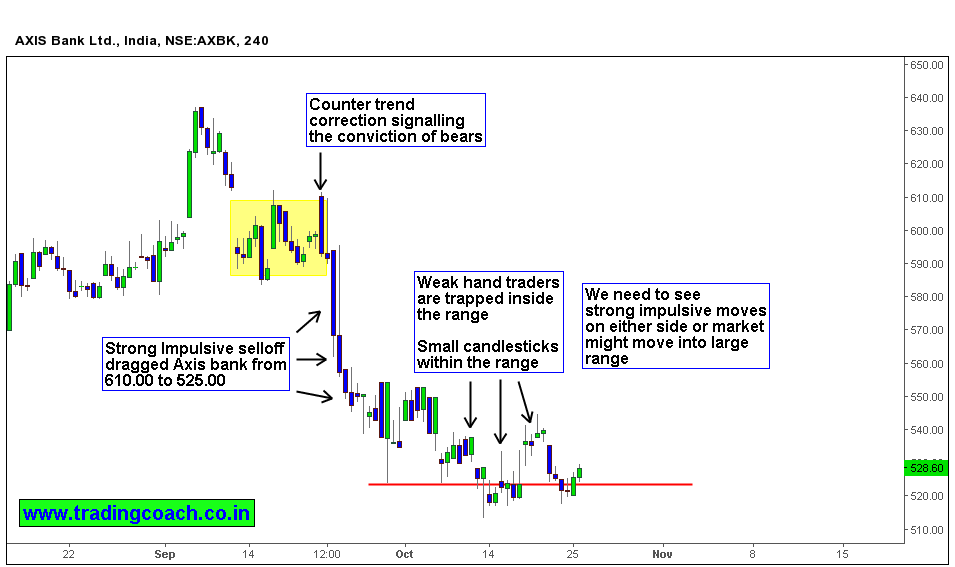
My previous article of Axis Bank Technical analysis, pointed out the possibilities of stock moving below 520.00 price level. Counter trend impulsive movement in combination with key level analysis helped us to arrive at this insight. (Methods and techniques of key level analysis are covered in depth on my trading course).
Strong impulsive selloff dragged Axis bank from 610.00 to 525.00; the selloff might be a result of position adjustment by High scale liquidity players such as Mutual funds and Index funds. Despite positive fundamentals, Axis bank has shredded its earlier gains, mostly as a result of geo political conditions and profit taking factors.
We can see that market is trading in a tight consolidation between 554.80 and 524.80. An interesting development is the small candlesticks with medium-sized wicks or shadows within the range. These candlesticks represent the involvement of weak hand players like retail traders, and dumb money investors who sell at lows and buy at highs. Also the liquidity is decreasing in the stock, which might cut our positive risk – reward opportunities.
It is better to wait till we see a strong impulsive movement on either side (up or down). Stock is in random period, we couldn’t spot any imbalance clues in Price action. Best thing is to wait till we find any price action clues or range expansive swings.


