

The sentiment in Bank Nifty might change in coming weeks as Bank Nifty shows a wide divergence between bank nifty and Momentum. Index prices are making higher highs whereas momentum measured by MACD is stagnating without any direction. It’s a representation that trend is getting weak. As a rule of thumb, momentum must precede price or in simple terms momentum and price movement must correlate with each other. Analysis on Daily chart of Bank Nifty reveals this scenario in a proper sense.
Bank Nifty Price Action Analysis in Daily chart
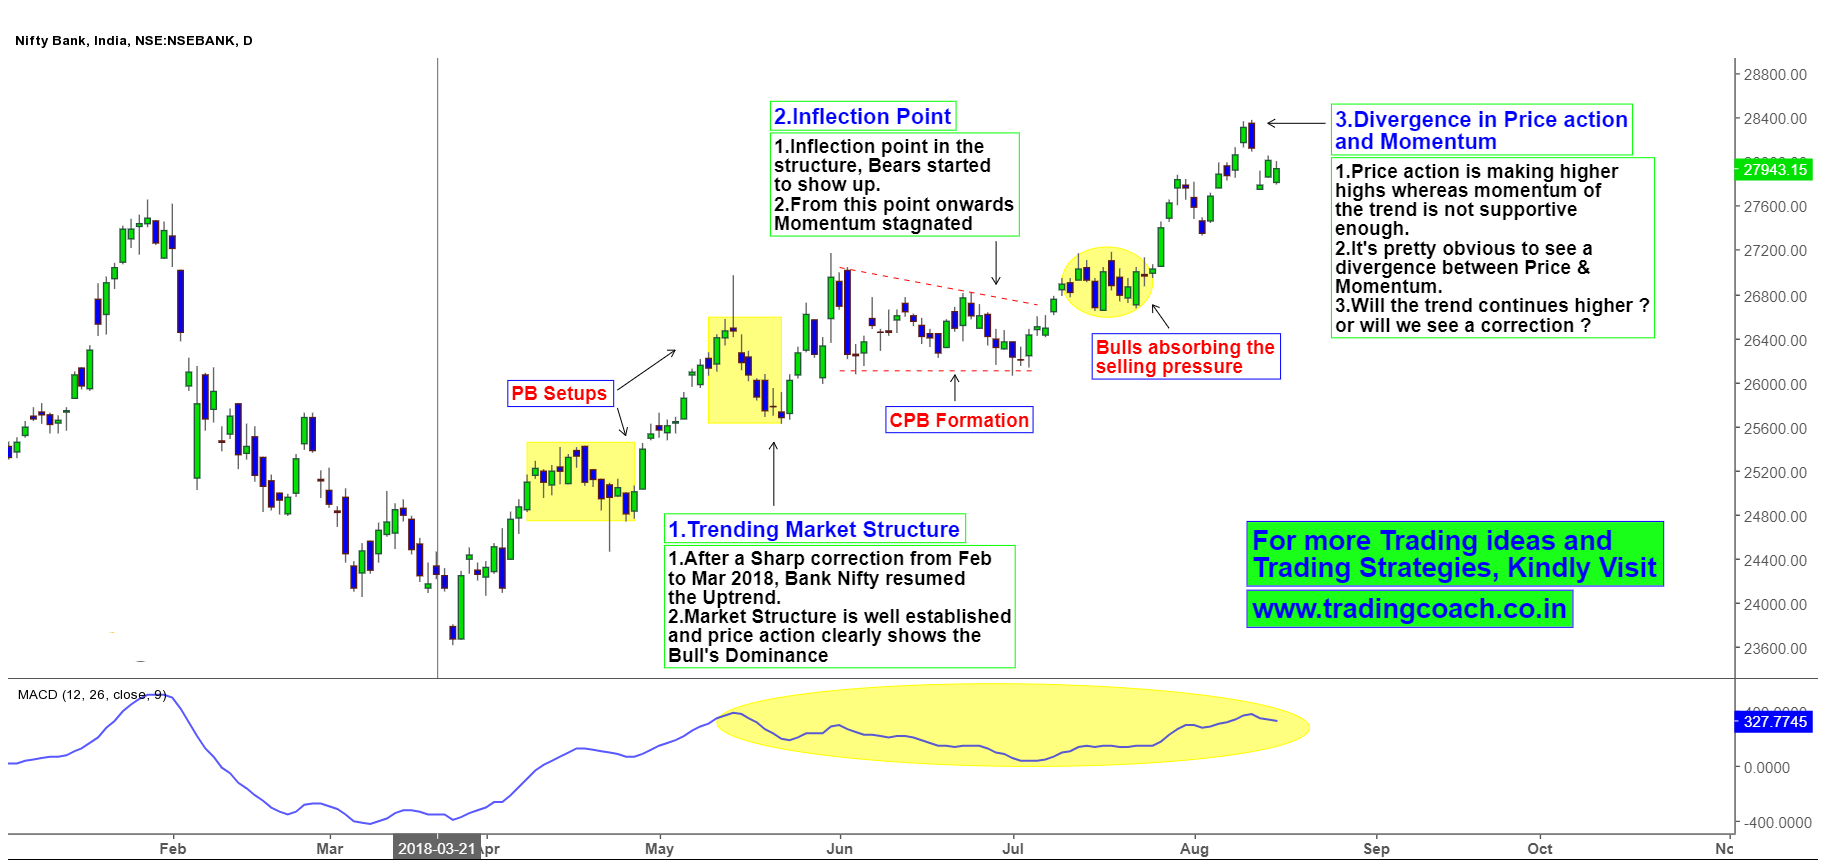
After a sharp correction from Feb to March 2018, Bank Nifty started moving higher and a clear uptrend got established in the month of May. But after touching 27000, selling pressure increased and price action formed an Inflection point in the Trend. MACD also went sideways as an indication of changing momentum. In the onset of July, Bank nifty again started to make higher highs but the strength of Trend legs decreased and MACD kept oscillating in sideways direction. It’s a pretty obvious sign of Divergence between price action and momentum.
Does it mean there will be a correction in Bank Nifty? Or Will the trend keeps moving higher without any adherence to these signs? Whatever is the case, it will be interesting to watch further development of Price action in Bank Nifty. Traders must keep an eye in Daily chart and take trades accordingly.


