

Though recent price action in Nifty is messier and uncertain, Daily chart of Bank Nifty provides a clear perspective. When inferred along with fundamentals the market action makes clear sense. From the viewpoint of pervious intraday price action, Market is fluctuating in a random tone. Q4 results of Bank show stress on the banking system because of Bad loans or NPA’s, RBI problems on mandatory and term of Raghuram Rajan all these are major factors which might influence the investor sentiment.
Below is the Daily chart of Bank Nifty with Price action analysis.
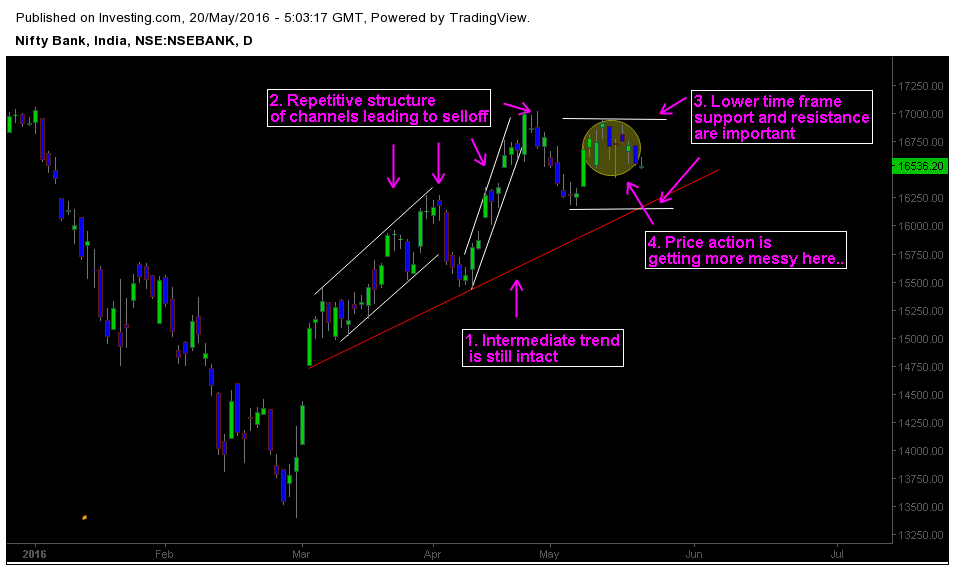
1. Intermediate trend is still keeping up.
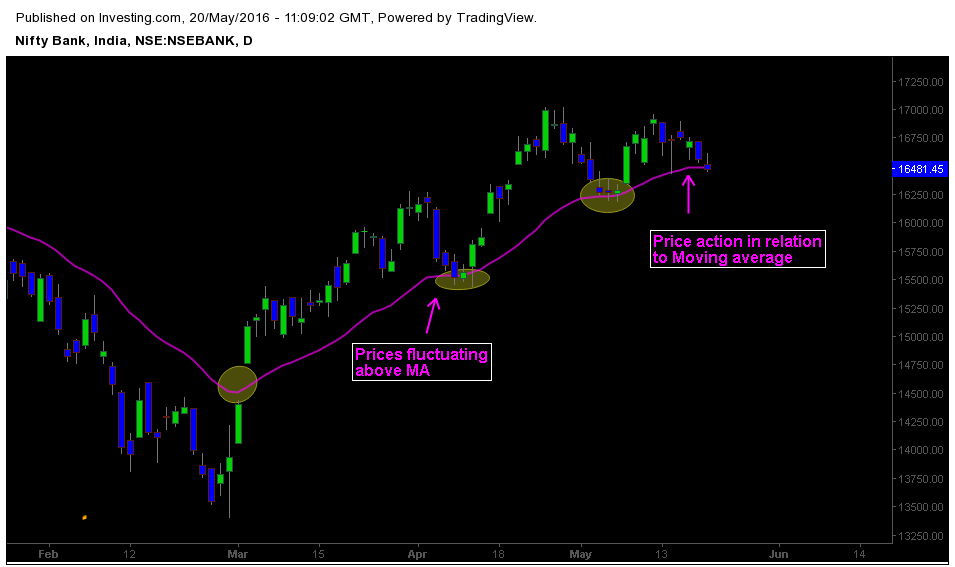
If there is one reason to refer higher time frame charts, it has to do with clarity and precision. Regardless of recent noises on lower time frame, Daily chart shows the market structure in a clear way. Bank Nifty is testing the 25 period EMA on daily chart, and price action is still above intermediate trend line.
2. Repetitive price channel formations.
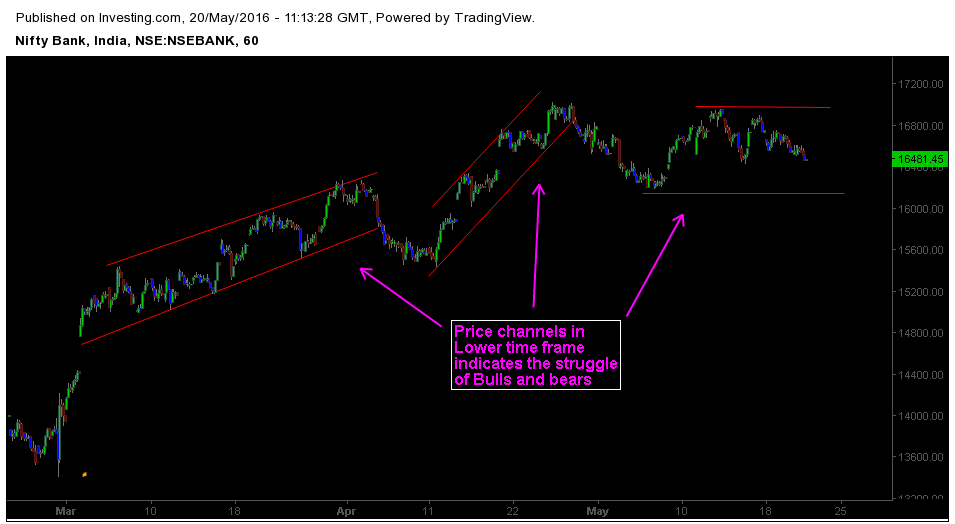
Some interesting development within this market structure is the repeating formation of price channels. The structure is subtle which makes it hard to grasp. But a skilled chart reader can infer multiple structures in one timeframe. These price channels have ended in climax, leading to temporary selloff. It indicates the struggle of bulls and bears to dominate the market sentiment.
3. Lower time frame support and resistance are important.
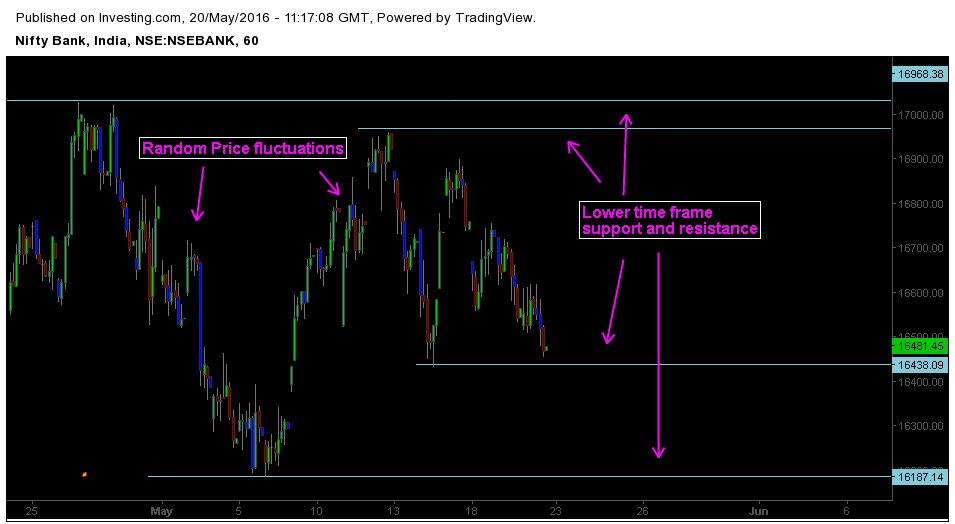
On Lower time frame charts, Randomness is influencing the price action. Noisy traps and pitfalls indicate the shortage of liquidity and shakeout of weak hand players. To get a better Gauge of market structure on Lower time frame, it is essential to keep an eye of Minor support and resistance level. Another reason to watch these key levels is price fractals. To know about price action and Fractals read this article.
4. Messier Price action on Lower time frame.
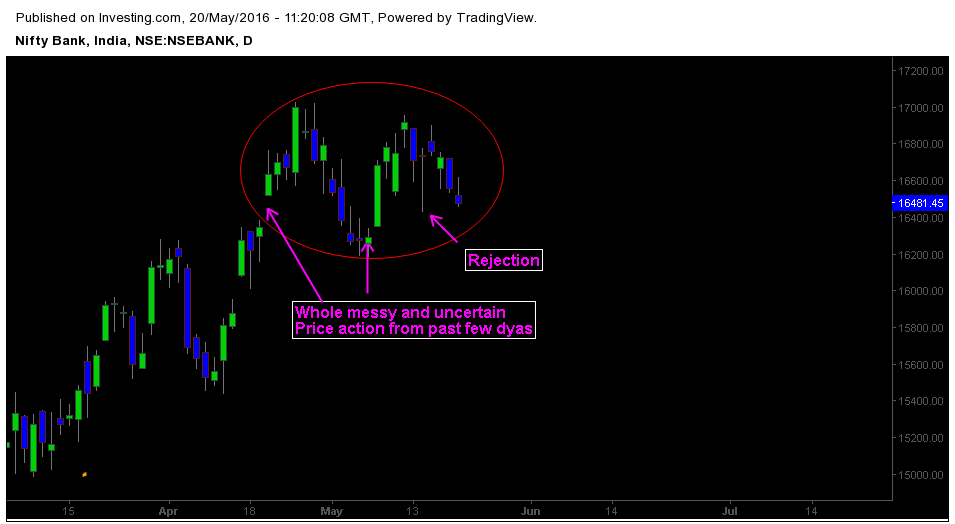
Recent Price action in Bank nifty was harder to perceive and infer. Market structure on Lower time frame charts are cluttered by noisy price fluctuations. Traders should wait for better clues about market direction. Keep an eye on important key levels and next week’s opening price action.


