

Bank shares rose to their highest in 20 months, Price action is so close to 2015 high at 21000.00 due to spectacular performance of major companies in banking sector. Foreign investments are the main reason behind these price movements. It’s also important to note that foreign investors bought these shares amid the rebalancing of MSCI indices. MSCI increased it’s weightage on a couple of bank stock led to active and passive buying from FII Funds. Though the underlying fundamental factors are optimistic for Bank Nifty, the chances of technical correction or at least a retracement is increasing in probability.
Bank Nifty – Price Action Trading Near the Yearly High
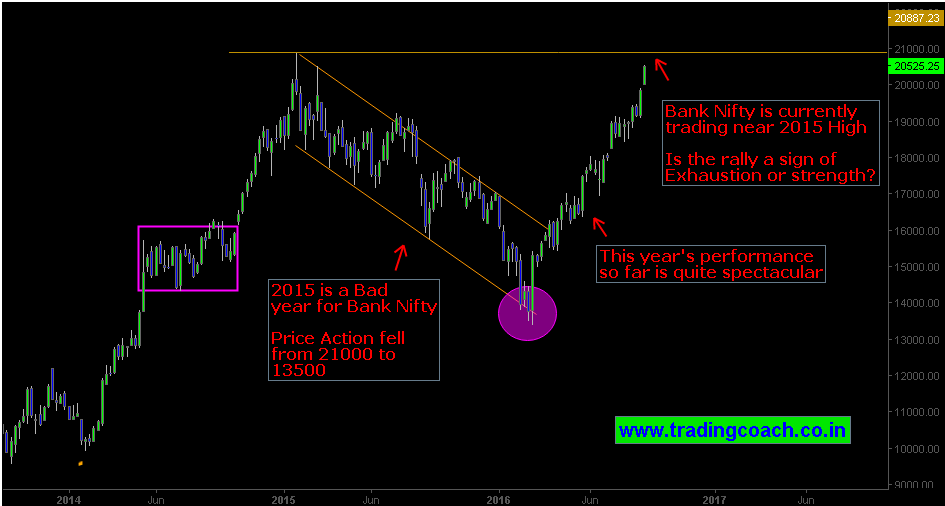
2015 was a bad year for Bank Nifty. The index fell from 21000 to 13500 respectively marking technical high and low. But the conditions changed as price action erased most of the losses made in previous year. Axis Bank and Yes bank were among the shares that saw increase in its weightage. Since many global mutual funds are tracking MSCI indices, any change over weightage of the index causes global funds to make adjustments on their portfolios. Bank nifty is now trading near 2015 highs
Price Channel Formation in Daily Chart of Bank Nifty
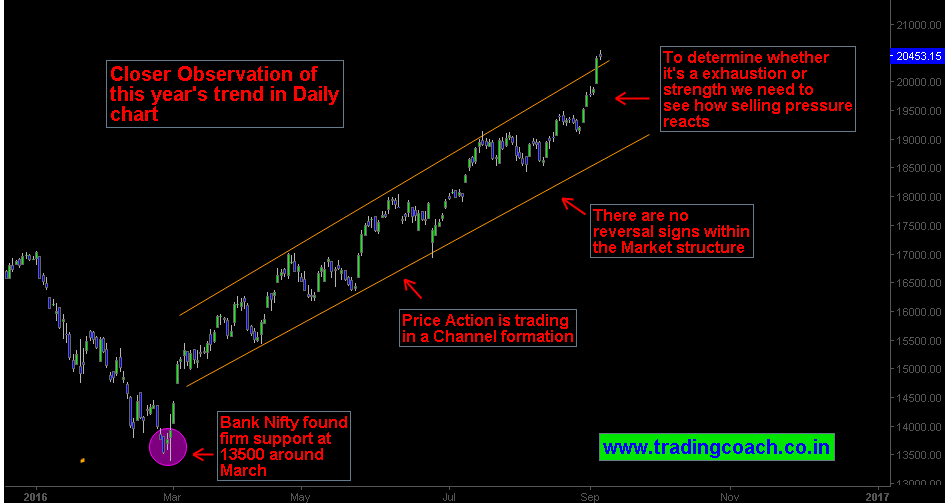
Recent decline in bond yields also aided the rally in Bank stocks by causing adjustments on their balance sheet, especially on Public sector banks. On Daily chart the price action becomes clearer and we see market is trading in price channel structure. Also some traders are pointing out upcoming monetary policy stance as the main mover behind the rally. The question we face now is “whether the recent rally means strength or exhaustion of buying pressure” To figure the answer we need to see how sellers will react around important resistance zones. Traders should focus on Buying and selling pressure of the price channel in Daily chart.


