

Trials are blazing in bank nifty as market is putting an uncertain show for short-term traders. Why price action is playing a chit-chat choppy game in Bank nifty? There are many reasons to point out from monsoon to Br-exit referendum. But it is better to fix all the reasons in one group called as “Macro”.
Coming to the point, recent price action is testing the trend line resistance zone at 18000. Below is the daily chart of Bank nifty showing current price action.
Daily Chart of Bank Nifty Utilized for Price action trading.
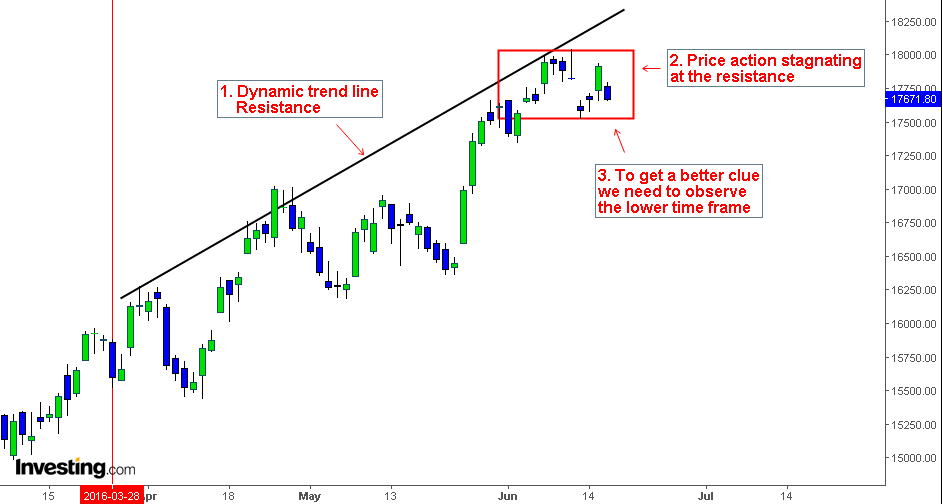
1. Since from April 2016 Bank nifty is making higher highs, I updated about these specific movements from time to time. If we notice closely, we can see price action is creating resistance levels parallel. The “dynamic trend line or cross line” in technical terms is acting as a pivotal resistance in Bank nifty.
2. Currently the resistance zone is at 18000(from a higher time frame perspective). Price action is stagnating near the resistance zone. This same price action in lower time frame is perceived as choppy–consolidated movements. The consolidation is extending between 18000-17500.
3. To know the depth of the stagnation or to understand the price action in a better way it is necessary to zoom on lower time frame. Watching the same price behavior from multi time frame is better than one time frame.
Hourly Chart of Bank Nifty utilized for Price action trading.
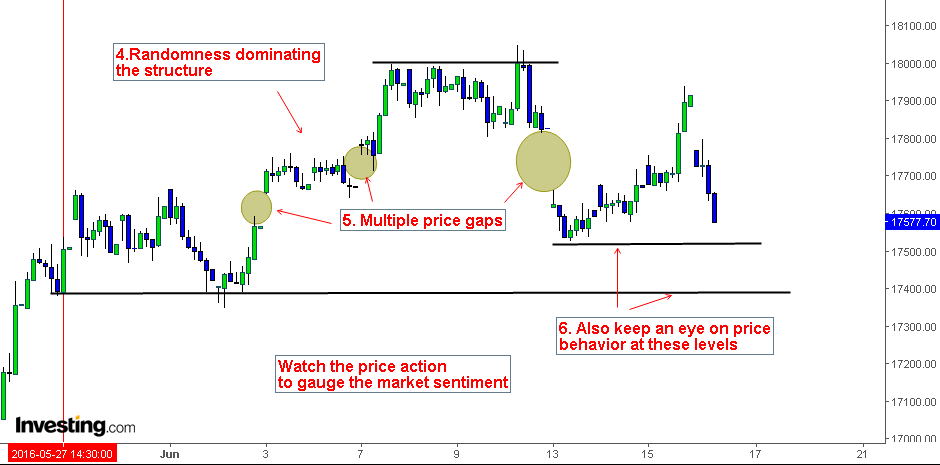
4. It is no wonder that randomness is dominating the current market structure. Usually the character of random markets is small candlesticks and lesser volume. Random markets write down lower participation rate. It’s also quite hard to initiate trades within this structure.
5. Multiple price gaps points out the liquidity factor within the structure. More price gaps means less liquidity which again confirms lower participant rate. With present global and political conditions, price action is consistent with it.
6. To gauge the market sentiment and trading bias, we need to see how price behaves at specific spots such as important key levels, Patterns etc. In this case traders should focus on resulting movement within the lower time frame structure and key levels at 17400, 17500. Price action in lower time frame can shape the higher time frame structure.


