

Since Gold, Silver and crude oil is stealing the spot light while Copper is neglected by Traders and Investors! Another reason is Prices are struck within the tight range of 2.75 – 2.45 (It’s clear on Weekly chart), without much movement it’s not getting traders attention.
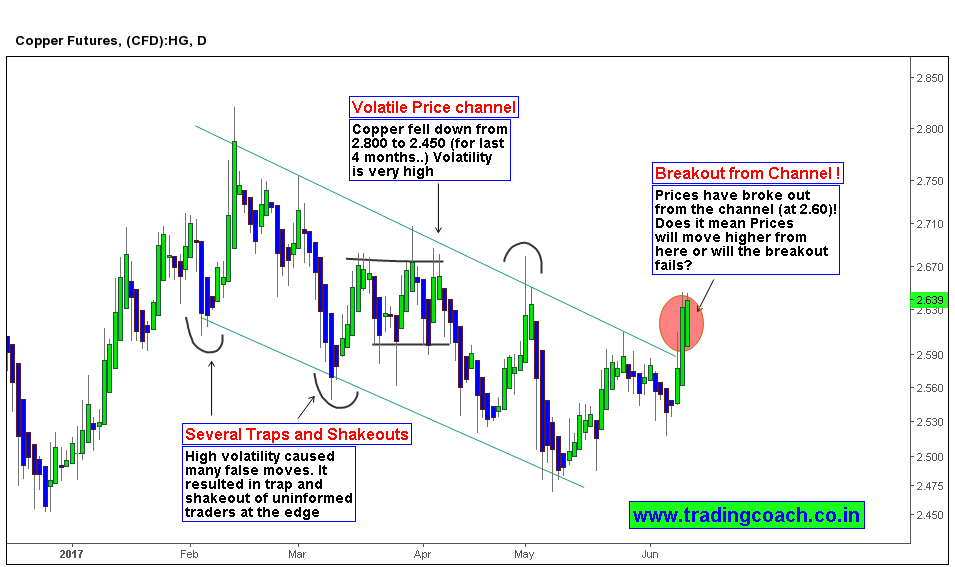
Despite the weakness of US dollar (DXY) during the months of Feb to May, copper prices tumbled from 2.800 to 2.450 in the same period. (Historically Copper and USD have negative correlations) Apart from breakdown in this historical correlation, High volatility dominated copper prices throughout the period. As we see the chart, it’s obvious to spot multiple false moves and traps around the edges of price channel, which is a result of High volatility.
If we pay attention to recent Price action, there’s a breakout from the upper channel line(at 2.60). The breakout is also accompanied by turnaround in momentum. Does it mean copper prices is prone to move higher? Or given the present context of false movements and traps will this breakout be another failure? Either ways, it would be interesting to see what happens next! Traders must watch copper price action in coming days; we might get potential trading opportunities on this one…


