

Copper has formed an absorption structure on Daily chart. The name absorption structure might sound weird but don’t let your assumption fool you! Absorption structure is a market pattern identified and termed by Richard Wyckoff. As per Wyckoff, when supply overwhelms demand or demand overwhelms supply – The dominating pressure absorbs the opposite force. For example, If Buyers are dominating the market sentiment then buyers will absorb the selling pressure to push the price in opposite direction.
The current price value of copper is 2.147 and Daily chart is indicating an absorption market structure
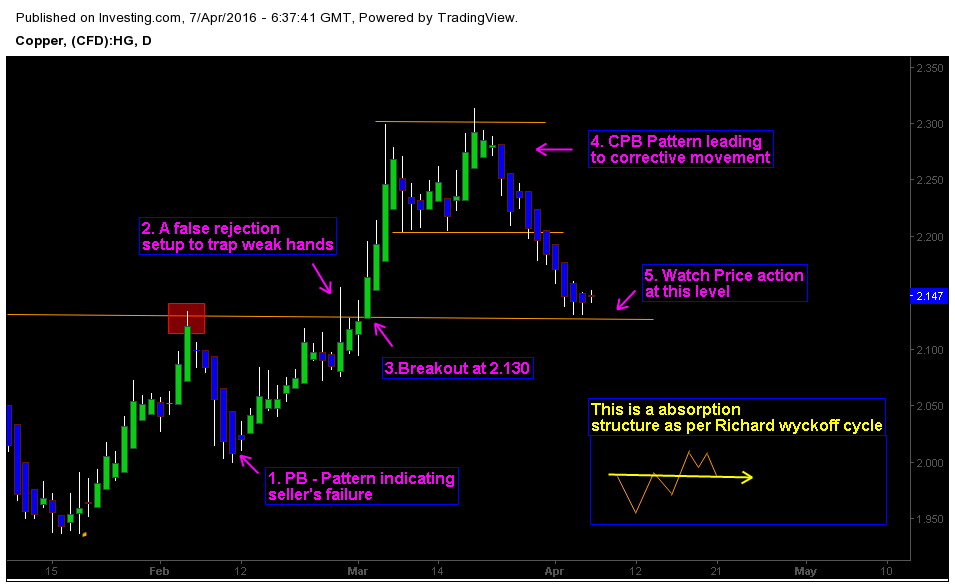
1. PB Pattern indicates the failure of Sellers to sustain the selling pressure
After testing the Key level at 2.130, Copper sold off from the level but selling pressure didn’t sustain for longer period. Buyers started dominating the price action from 2.000. This created PB Pattern which signals the failure of selling pressure.
2. A False Rejection Setup to trap the weak hand players.
Notice the Second test at key level 2.130; we can see how this pattern was later violated by price action; Institutions use them to trap weak hand players. Price action is not about trading patterns or giving fancy names to candlesticks, it’s about understanding the behavior logic of buying and selling pressure. A prudent price action trader would avoid such kind of patterns. In this case, false rejection pattern trapped the weak hand players.
3. Copper Breakout at key level 2.130
Following the false rejection setup, Copper had a steady breakout at key level 2.130. In order to confirm the strength of buyers – it’s essential for price action to stay above the breakout zone. On the other hand there are also chances of buying pressure running out of steam. Traders should check the momentum and strength of price action.
4. CPB Pattern led to corrective price action
After strong rise, Copper stagnated at key level 2.300. Consolidating movements later turned into corrective selloff most likely driven by liquidation and positioning effects. Copper shed its earlier gains, fell from 2.300 to 2.147.
5. Watch the Price action at Key level 2.130
We need to watch the price action at key level 2.130 for potential trading opportunities. From a big picture perspective it’s a Richard Wyckoff absorption Market structure. Clear and strong break below the key level 2.130 will influence the market sentiment. If Copper manages to stay above 2.130, traders should watch the price action for directional clues.


