

The copper is silently stealing the shows behind the main stream headlights; the price action is now testing the technical resistance level at 2.235. The industrial metal is known as common gauge for global economic growth, it’s obvious that copper is watched not only by speculators but also large-scale macro investors and Institutions. It’s rebound from seven year lows set in January 2016 is influencing market sentiment.
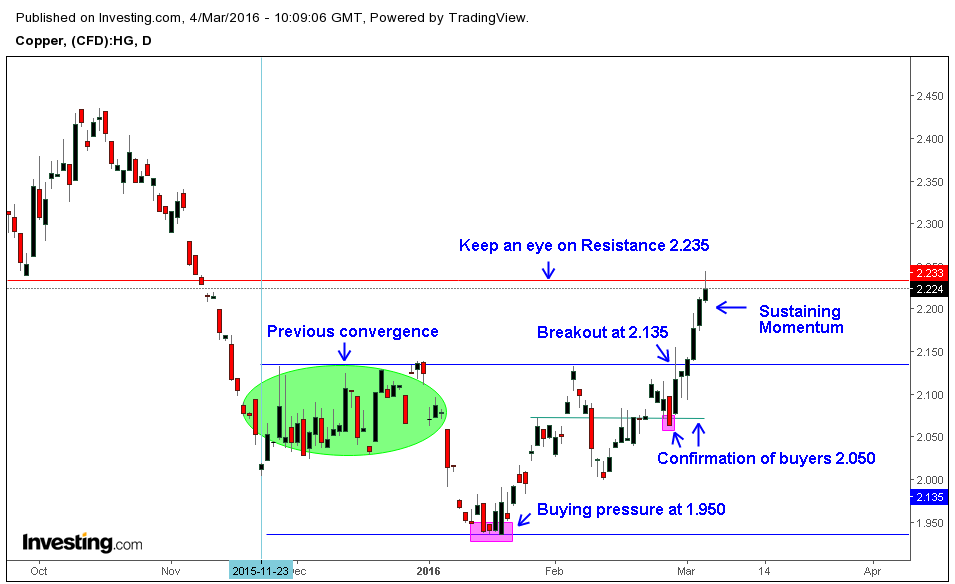
Copper was in range bound market structure since December 2015, Price action struck between the range of 2.140 – 1.950, we can also notice some previous attempts by buying pressure to break the resistance level at 2.140, especially around mid December – Look at the chart how price action converged at the key level. The failure to break 2.140 at December led to a mechanistic selloff, caused by liquidation and volatility.
Price action rebounded after touching the support level at 1.950; this movement indicated the willingness of buying pressure. But the rebound was not strong enough to confirm the real strength of buyers. Later Price action around 2.050 provided detailed convictions about bull’s willingness to break the resistance and weakness of sellers to defend the key level. Any astute price action trader could’ve initiated long positions, after looking at confirmation of buyers at 2.050.
In the beginning of March 2016, Copper broke the three-month resistance level at 2.135. Gauging the bullish price action before and after the breakout reveals some important information about the market behavior. The strength of the buying pressure after the breakout was strong enough than before the breakout, this means two things 1) Market made a decisive push to break the resistance at 2.135 or 2) This is nothing more than another short covering rally.
It is hard to understand the real sentiment clues behind the price action, until clear picture emerges. Traders should focus on price action formations at present resistance level 2.235. Movement from here should give further directions on market structure and psychology. One interesting aspect is copper is not leading alone as before, this time it’s following the footsteps of other metals including Aluminum, Nickel and Tin. Tread carefully and Of course, have a great weekend.


