

After constantly trending upside for nearly a Year, Crude Oil prices are witnessing volatility and sideways Price action. Trend has terminated into sideways or Range bound. We can clearly see a range bound market structure on Daily chart spanning since Feb 2018. Trend trading strategies which were performing better in the trend structure is no longer valid. I have already pointed out trend termination possibilities in my earlier update on Crude Oil. Here’s the Present update on Crude Oil.
Crude Oil Price Action Analysis on Daily Chart
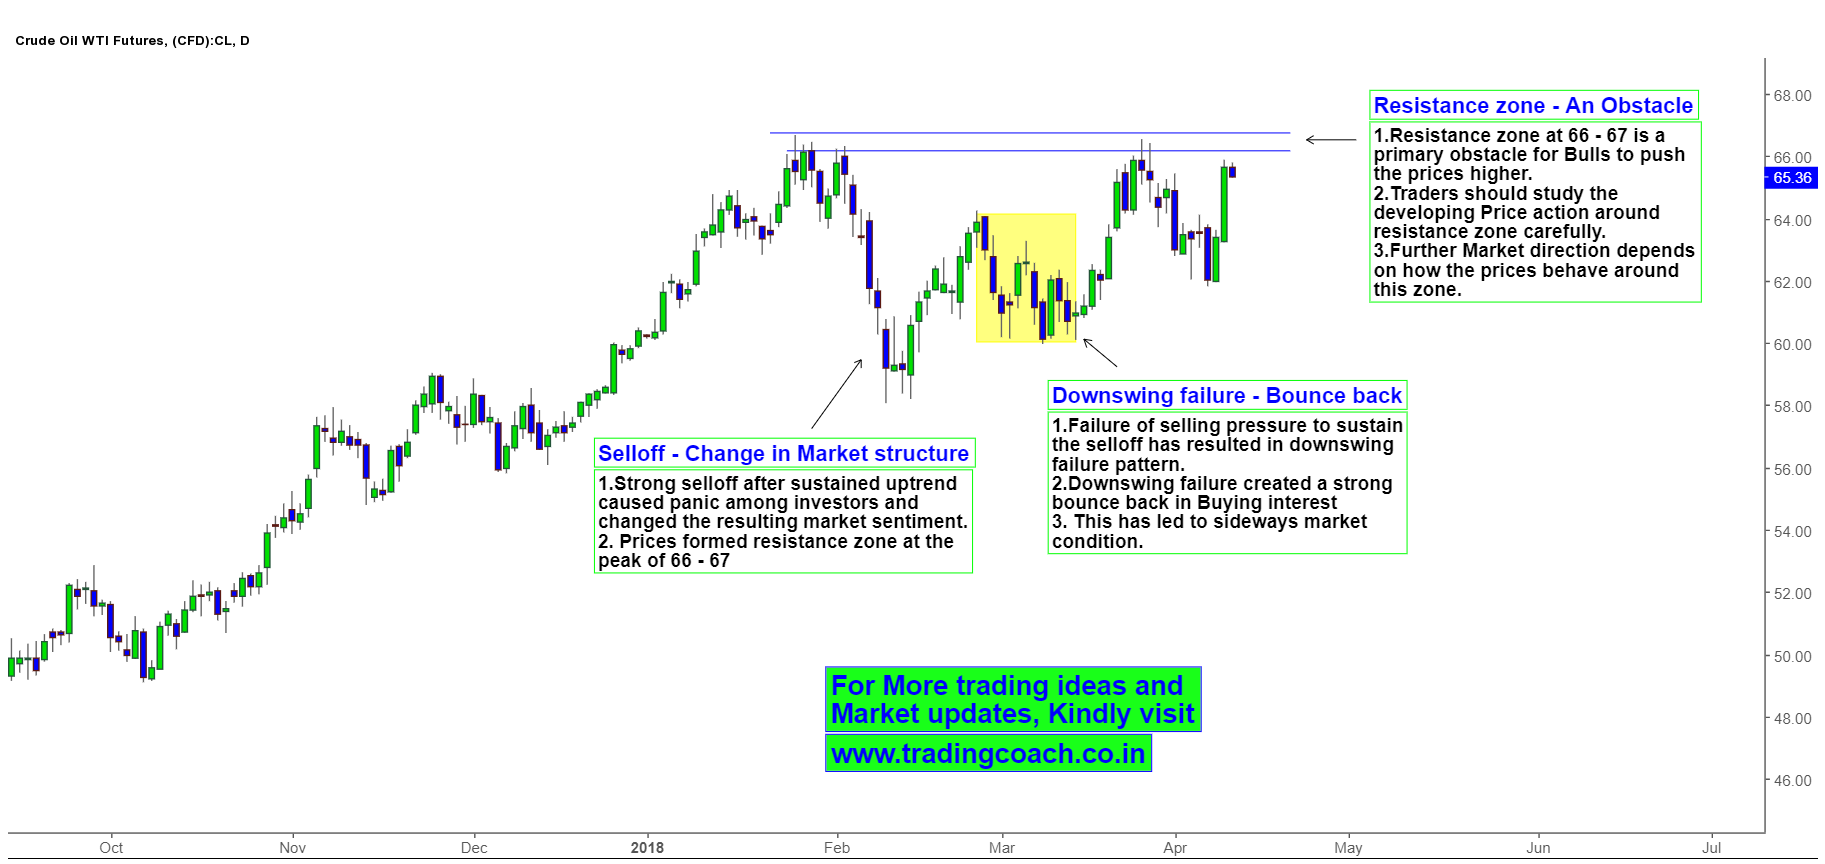
A strong selloff in the month of Feb, Market structure reversed from uptrend to Range. Price action formed structural resistance zone at the peak (from where the selloff started) of 66 -67. Go through this Interesting content on trading support and resistance for more insights. But the failure of selling pressure in the month of March (Highlighted in yellow mark on the chart) created a downswing failure pattern. Market participants who took short positions before (in anticipation of further downfall) liquidated their trades, which in turn caused a bounce back rally in crude oil.
Right now, Market prices are trading near the structural resistance zone at 66 – 67. This zone is a primary obstacle for the Bulls. Traders should study the developing Price action around this resistance zone carefully because further market direction depends on how prices are going to behave around the zone.


