

Price action is marching towards 49.50-50$ mark. Global supply – demand situations and US crude inventories are influencing market sentiment. OPEC headlines do affect the price action but in a jerky and uncertain way. But in a sense of liquidity factor, rise in prices can also be a result of asset allocation in commodities by institutional players. Market structure reveals some interesting information about developing price action. Current Price value of crude oil is 49.27$ per barrel in International market.
Below is the 4h chart of Crude oil with price action analysis
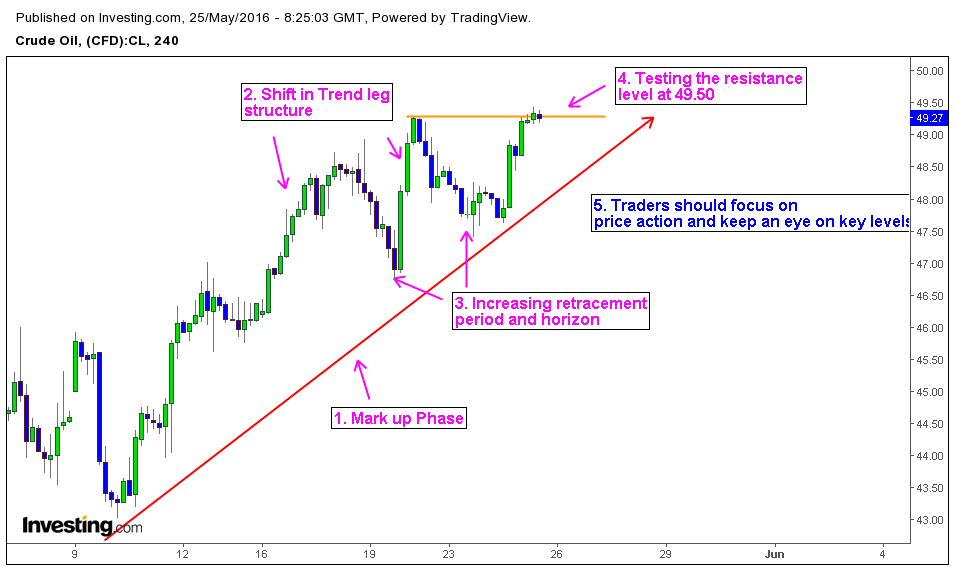
1. Price action is in Mark up phase
In a Wyckoffian sense, Price action is trading in a mark up phase or trend structure in 4h chart. Though market is making higher highs, we need to focus on price reaction at specific support and resistance levels to get a better idea about market sentiment. Also we can make some specific observations about the structure which offers some hint about market psychology.
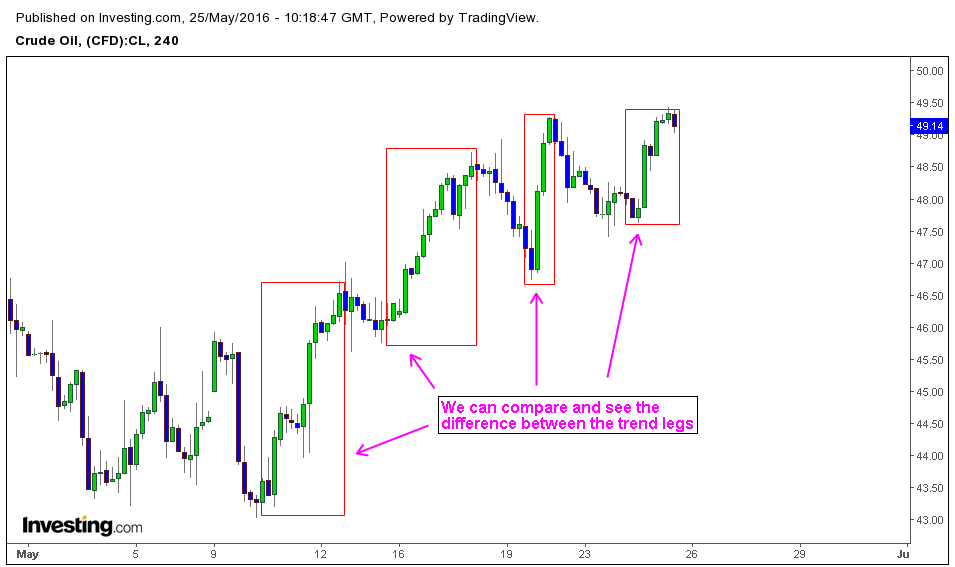
2. Trend Leg structure is more climatic than previous trend legs.
When we compare previous trend legs with recent ones, we can notice the difference in structure. Previous trend leg is more authentic sign of buying pressure and the recent movement indicates a climatic price action.
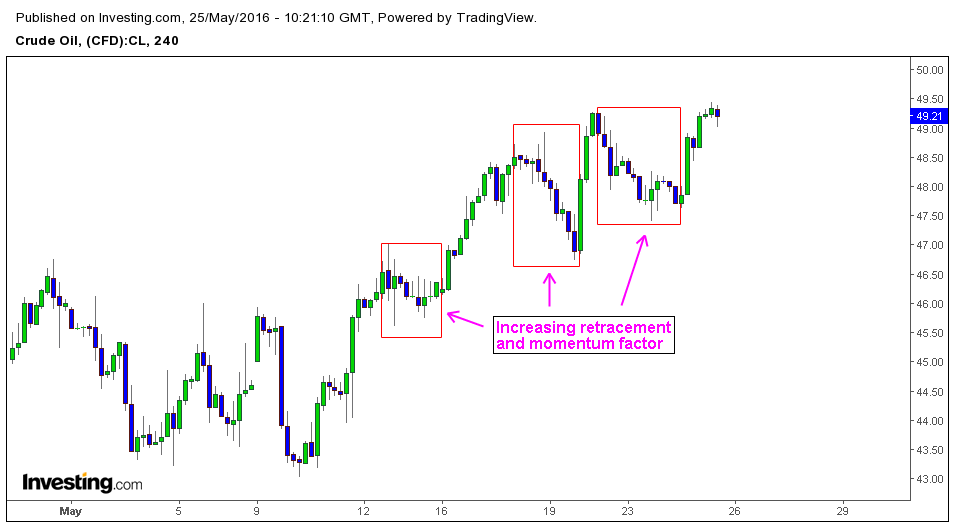
3. Increasing momentum and time horizons of retracement.
Strength of retracements can tell us about the trend integrity. Recent retracements, trend legs and earlier retracements show the momentum of both buying and selling pressure. A prudent trader should take these aspects into consideration.
4. Crude Oil is testing the resistance level at 49.50
Crude oil is testing the resistance level at 49.50. Also it’s important to consider that 50$ mark is just above the resistance level. Price reaction at these levels can influence the bias of market participants. Traders should focus on resistance levels at 49.50-50.00 and support levels at 48.25 and 47.50.


