

Gold, it’s been a while since I made earlier market update on gold. The beauty of price action is that “more it develops more the probability of anticipating future direction” Recent developments within gold are giving clear-cut signs of market sentiment and investors behavior. From the point of short-term traders, Gold is still a messy picture. Favorably long-term charts show the background games within price action.
Below is the Monthly chart of gold with price action analysis
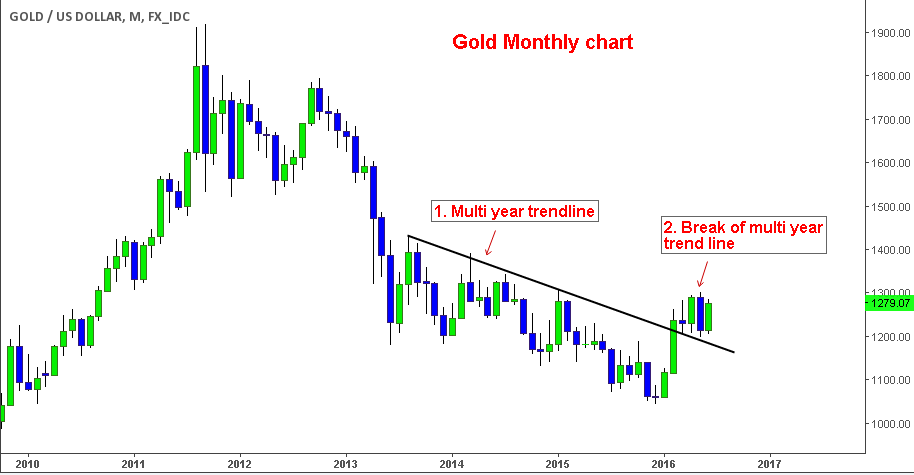
1. So the trend line we see in this chart is a multi-year trend line (visible since 2014!). Trend line is spanning around 1200 -1250 zone. It was technically a resistance zone in daily chart. Multiple confluence factors such as swing points, radar levels etc. are converging at this specific area. Given all these factors we can see prominence of the zone 1200-1250.
2. This year gold broke this specific trend line. As we can see the chart, tendency of the break is not yet clear. If this is actually a breakout then it’s a game changer for gold given the converging factors at this specific key level. On the other hand if this is mere delusional shakeout then it’s worthless to pay attention to the move, because sooner or later prices will follow the same direction as before.
Is it really a game changer or just another consequential movement? Which one is it? To find out let us zoom into lower time frame.
Weekly chart provides a better visual cue of price action after the break of multiyear trend line.
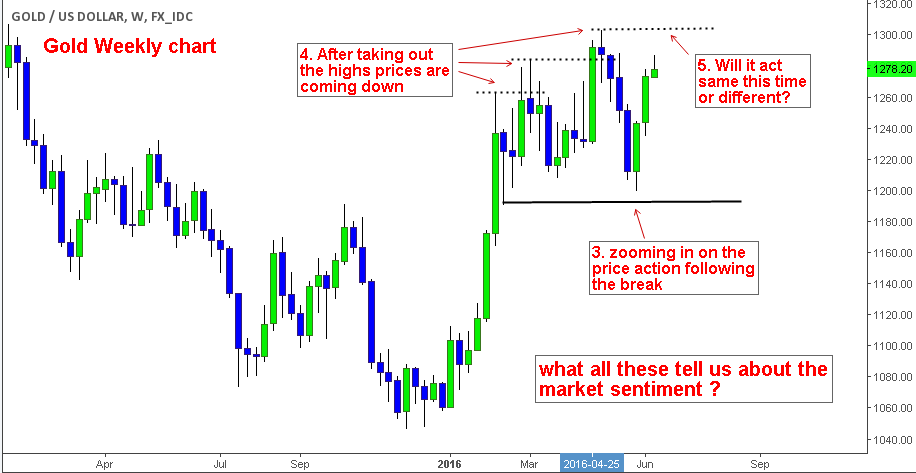
3. Since the analysis primarily focuses on Price action after the break of multiyear trend line, it’s better to rely on weekly chart which is an essential lower time frame alternative for monthly chart. Zooming into the structure we can notice some interesting observations.
4. After taking out the highs, price action temporally reverses back to the previous point. It indicates one of the either two factors. 1) Buying pressure can’t sustain above the previous high as it is met with equally powerful selling pressure or 2) Smart money players are liquidating some of their positions due to cautious nature of this specific movement. Again it’s a paradox, we can’t really figure which one of this cause is really playing out…
5. To conclude which one of this factor is really taking place we need more evidence from price action. So the best thing is to watch how price reacts when it tests next resistance level at 1300. Following movement after the test reveals the true nature of market sentiment and market structure.


