

Gold is trading in a Rigid Structure. Higher time frame price action is more volatile, which makes it hard to find valid trading setups. For a while, I will focus on lower time frame to find opportunities. This is a 30 Min chart of Gold in International spot market, Current price value is 1226.75$
Following some of my readers’ feedback – I would like to change the way of writing my Trade Analysis. Price action trading is not a complicated trading strategy, it’s fairly easy to learn and apply. But we need consistent experience to become a successful price action trader.
Through Market structure analysis, we can note some facts on the price chart, following below is a brief description of the observed facts in Gold.
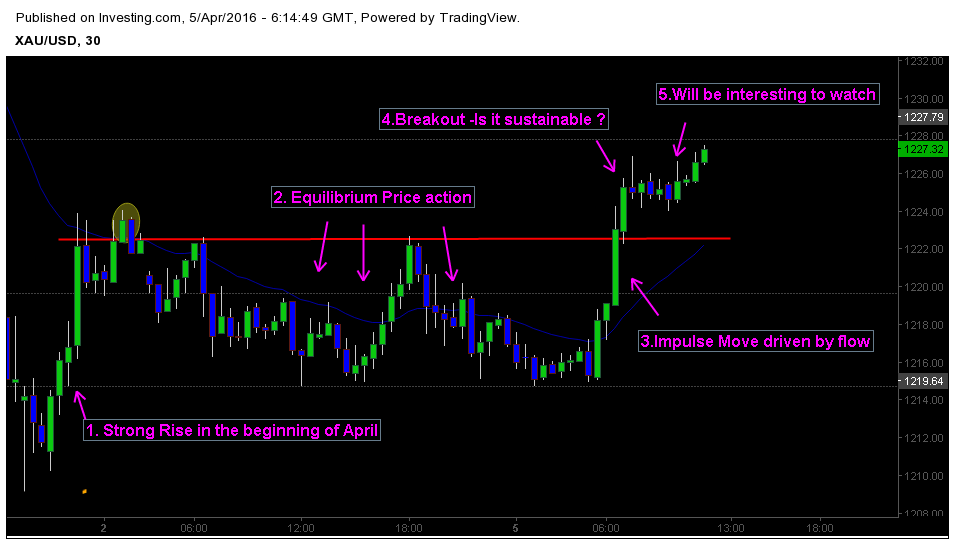
1. Strong Rise in the beginning of April at the close of trading day
In the beginning of this Month, Gold rose 13.89$ per ounce. Even though not a significant move, Impulsive price action at the beginning of new month might tell us more about the market sentiment and dynamics. Strong rise in the beginning of April from 1209.07 to 1223.93, during last few hours before close of the trading day is due to seasonality factor. This might show that seasonality will dominate the price action this month.
2. Equilibrium or Random Market structure around Moving average
Price action was trading in random market structure from 2nd April to 4th April. Random Market structure can also be referred as equilibrium price action or Consolidation. Random Markets indicate uncertainty in Market sentiment and there are no dominant forces visible in Price action. Neither buying pressure nor selling pressures was in control during this period. Price is in tight consolidation between 1223.93 -1214.77.
3. Impulse move from 1215.10 – 1225.26 driven by intraday flow
During 5th of April Gold rose higher again with strong volatility. A sudden spike above moving average trapped retail traders who were short in earlier market structure. Price action rose from 1215.10 to 1225.26 caused by liquidation or short covering. Institutional traders refer this kind of movement as “flow”.
4. Technically a Breakout Pattern.
From a big picture perspective, it’s a breakout formation. But one important aspect is to notice that price action is driven by flow not real conviction. We need to see strong buying pressure to get confirmation of Market sentiment. So, Technical question is whether the breakout is sustainable or not. Price action at `key level 1226.00 will influence the market structure.
5. Will be interesting to watch post breakout
Market structure should offer further technical clues. Price action should stay above the breakout zone 1224.00 to confirm the strength of buyers. Any strong selloff below the level indicates the strength of selling pressure.
Update: Current Price value of gold is 1231.75..


