

Since Jan, there’s not much change in Gold Prices. Market structure is still in Range. Prices are trading within the borders of structural support and resistance zone. Structural Support zone is at 1310 – 1305 whereas Structural resistance is at 1360 – 1357. A combination of Dollar strength and selling pressure is influencing Gold’s Price action. Here’s the recent Price Action analysis on Daily chart.
Gold Intermediate Price Action Analysis in Daily chart
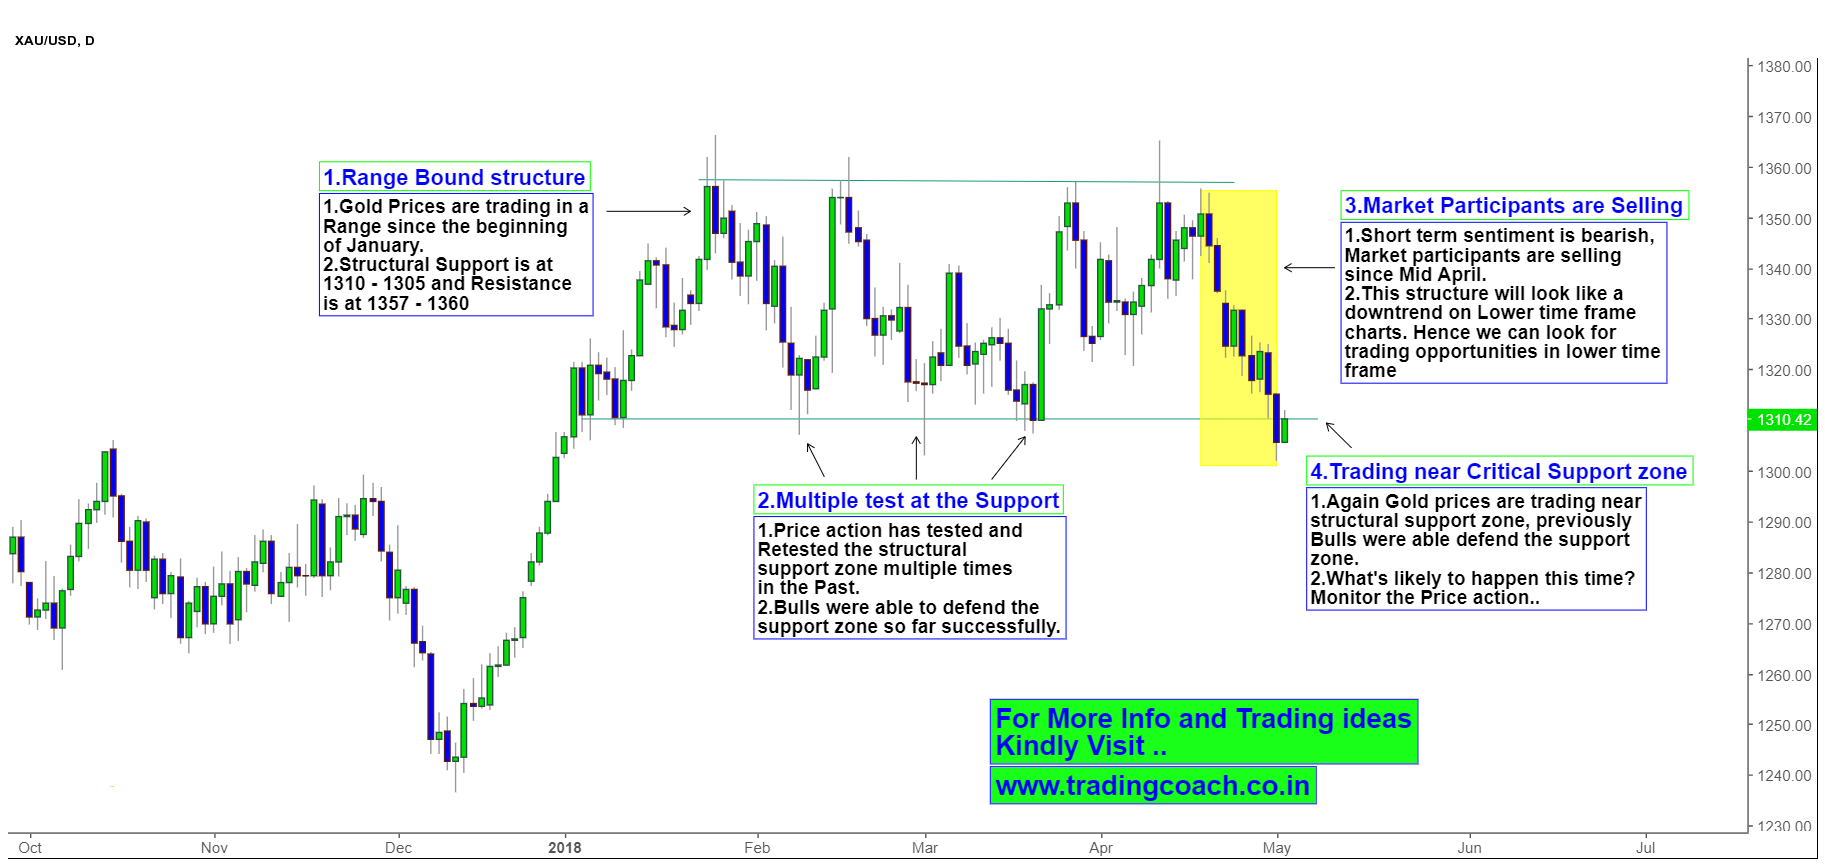
Looking at the recent Price Action, we can observe that short term sentiment is bearish. Market participants are selling since Mid-April. Price declined from April 16, resulting in Gold Prices losing almost 50$ per ounce value, as per international Spot prices. In just nine trading days, Gold prices tumbled from 1360 to 1310. The structure looks like a downtrend on lower time frame on 15 Min and 1 hr. Charts. Strong Dollar and bearish sentiment are the pre-dominant factors which pushed gold prices towards the structural support zone 1310 – 1305.
As we can see, Right now Prices are trading near structural support zone. Price action has tested and retested this support zone multiple times in the past. Bulls were able to absorb the selling pressure and defended the support zone successfully over previous attempts. Can bulls replicate the same behaviour this time? Traders should monitor the Price action in coming days for answer. Whatever happens at this support zone determines the future direction of Gold Prices.


