

NIFTY WEEKLY CHART
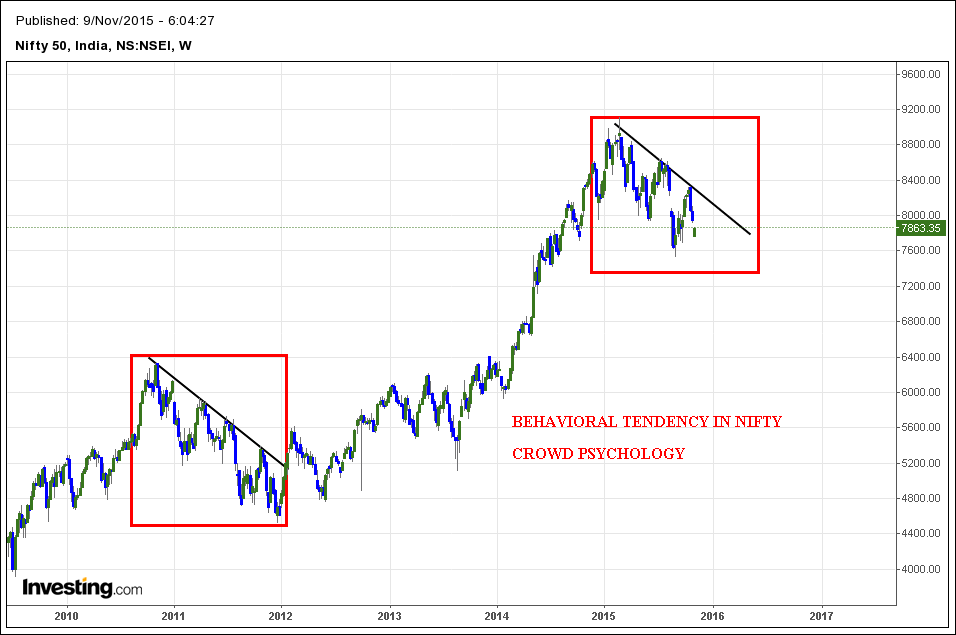
Notice the Nifty Market structure in long-term weekly chart; it’s obvious that present bearish correction is following a similar pattern, which occurred during the period of 2010-2011. As you can see, My Nifty trading strategy has made an analogical comparison between both periods. But there is a lot of Global macro difference, between both periods. The Great Bull rally of Nifty during 2012 -2015, after the past pattern, took place due to 2014 Indian elections. But now, we can’t anticipate any Nifty bull market to follow a similar pattern, due to negative macro factors. My suggestion is to follow the Price action on Daily chart, to take any reasonable positions. Or on an alternate scale, we need positive Macro factors.
NIFTY PRICE ACTION IN DAILY CHART
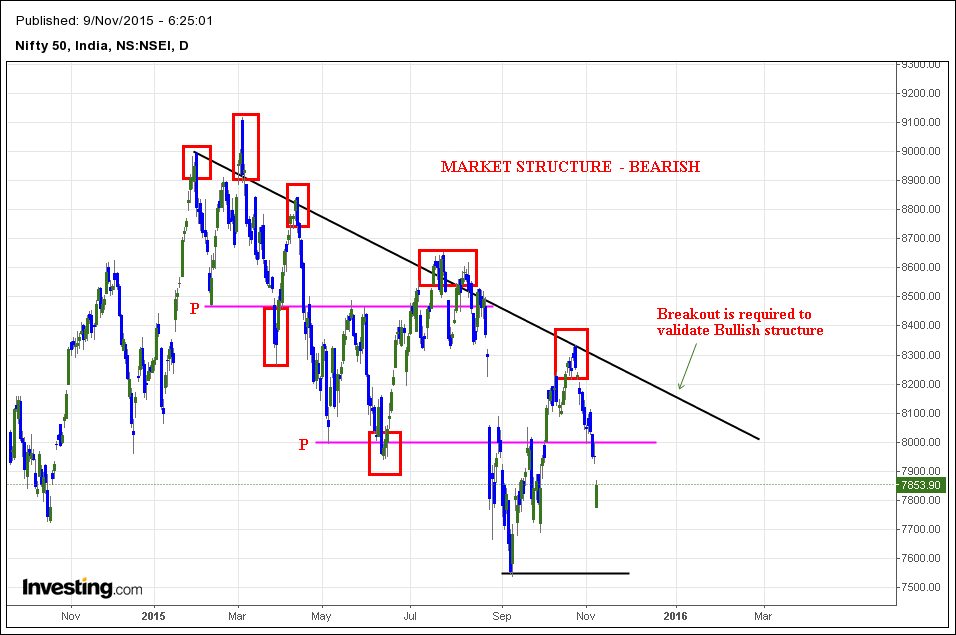
When you notice the Daily chart, it takes a little thinking power to induct that Nifty has already discounted the Bihar polls and election reports, even before the election took place!!. The Corrective downtrend is in fact evidential to the claim. Also my analytics on Nifty is suggesting that, in order to confirm the Bull market, we need the break the bearish trend line. When you notice closely, it makes sense that bulls are losing control on Nifty. The decision point, which is around key level 8000 remains in my focus now. All these observations-reasons confirm that, Nifty is in a Bearish range bound market. We need clear price action to confirm the Bull market. My suggestion as always is to track the Price not rolling the dice!! Be a Trader not a Gambler… Trade what you see.


