

Hindalco Share prices are consistently making lower lows since Jan 2018. Market prices tumbled from the high 280 and share prices are trading somewhere close to 220. Downtrend is spanning from 3 months, hence as per Dow Theory it’s an intermediate trend. The market structure is clearly traceable on 4 h chart, within the period of these 3 months; Hindalco shares lost almost 30% of its value.
Hindalco Price Action Analysis on 4h Chart
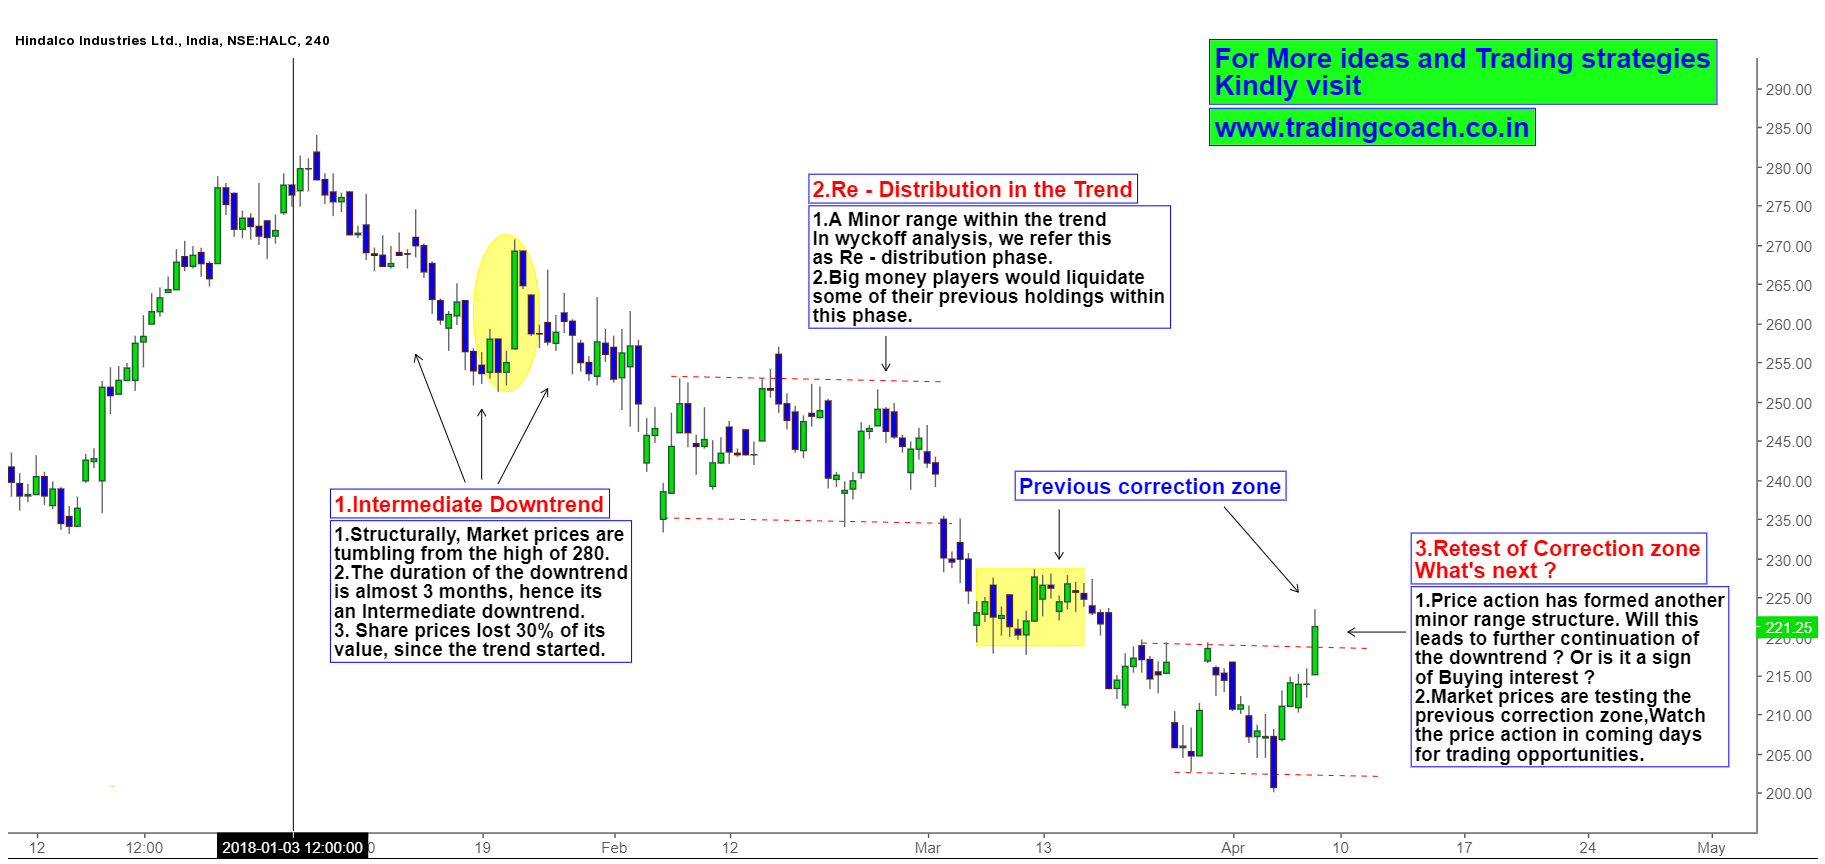
From the perspective of Fundamentals, A shift in Market sentiment triggered the downtrend. This bearish bias was further reinforced when US tariff hikes caused sharp volatility in global base metals. However the Business outlook of Hindalco remains moderate, hence a change in global base metal prices and business growth of the company might lead to a reversal of the current Price action.
In this month, we haven’t witnessed much movement in Hindalco but Price action has formed a minor range structure between tight boundaries of 202 and 219 within the downtrend structure. Also prices are trying to retest the previous correction zone formed around 230. Does it indicate any buying interest in the stock? Or is it just another trend continuation tactic? What smart money players are doing now? For answers keep an eye on Developing Price action, Traders might get excellent setup in coming days.


