

ICICI Bank stock prices fell 3.5% on last Friday was also one of the most active stocks on previous week. Price action is now trading in a range between 271.33 – 259.30. The bank’s net profit dropped 25% in June which is inline with estimations and forecast. Net profit for the quarter stood at 2,230 crores. The fall in profits were mitigated to some extent by raise in non-interest income and lower tax outgoing. Bond prices, treasury gains are big contributor for raise in non-interest incomes.
From the perspective of Institutional investors, they’re more cautious about Bank’s asset quality. Gross Non performing asset of ICICI bank has increased sequentially from 4.72% on December to 5.72% in June. The rise in bad loans effected the income growth with net interest income rising 0.9% y-o-y.
ICICI bank shares have under performed the Bank nifty from Past one year. Weakness in asset quality and earnings are the main reason for such a laggard performance. Traders should focus on Firm’s balance sheet, restructuring processes and monetary policy effects.
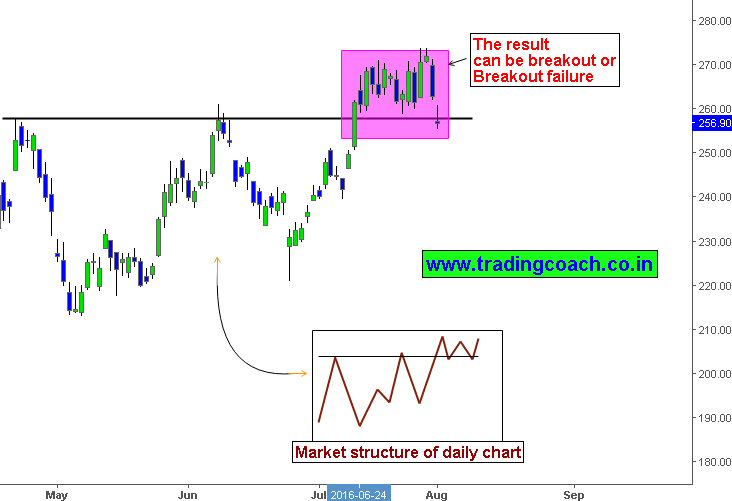
ICICI Bank Price action forms breakout retest setup on Daily chart
ICICI Bank Technical analysis on 4h chart – price action trading.
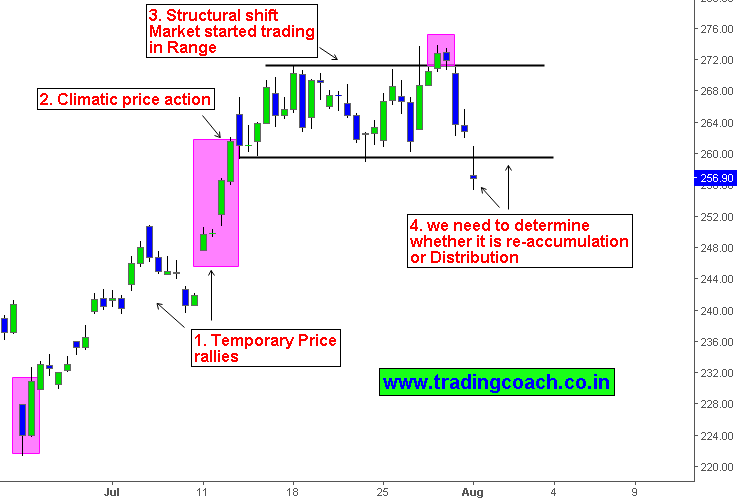
1. After consecutive falls, price action started rallying at the end of June. Most likely due to liquidation and positioning factors that caused temporary blunt on stock prices. The rally lasted from 221.50 to 271.00.
2. Following a retest at 240-250 support zones, prices climbed further in a climatic manner.
3. Failure of bulls to sustain above 271.08 resulted in structural shift from trending structure to ranging structure. ICICI started trading in a tight consolidation between 271.33 – 259.30. (Currently market has broken below the support level and retesting it again.)
4. We need to decide whether the range is accumulation or distribution to find trading setups and market sentiment. Traders should observe the price action of ICICI bank in 4h chart and daily chart to make valid trading decisions.


