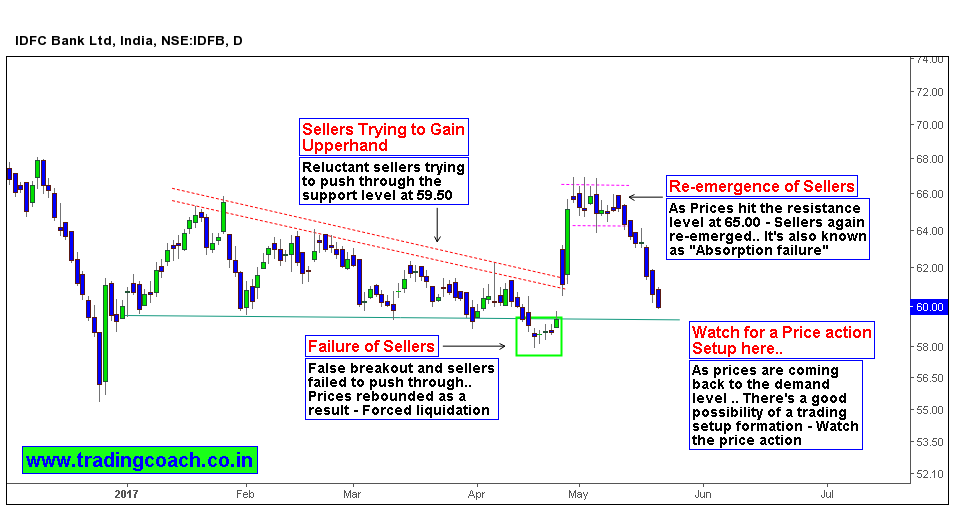
Sellers trying to gain upper hand in IDFB, Bears have already made multiple attempts to crack below the key support level 59.50. Look at the chart above (included with my price action analysis), its easy to spot the scenario.
In the beginning of 2017 stock prices rallied a bit, but soon the sentiment changed its course after price touched 65.50 (which now acts like a resistance level). Sellers desperately tried to push through the support level multiple times. The Price structure from Feb till Mid April looks just like a descending triangle which failed to manifest, as false breakout in the end of April triggered a sharp liquidation of weak hand sellers, eventually pushing the prices in opposite direction.
Though prices rallied a bit in May (due to false breakout in the end of April) Sellers again re-emerged from earlier resistance level 65.50-partially because of the failure in buying pressure to absorb the supply (aka “Absorption failure“). Now price is falling towards the demand area at 59.50 – 58.00, it’s an interesting key level to watch for a trading opportunity specifically for swing traders and short-term traders. Keep an eye on Price action near the key level; it can result in a trading setup.


