

Infosys started off the financial year on a tepid note, missing analyst estimates, report the profit estimations close to forecast and lowering the foreign revenue without guidance. Infosys Q1 profit falls 4.5% and cuts dollar FY17 Dollar revenue.
Charts are reflecting the pessimist attitude in a crystal clear way. Price action broke the support zone 1150-1125. Currently market is trading in tight range. Foreign investors and Domestic Institutional players will seek more evidence to gain confidence on country’s second largest IT services exporter. What is Price action trading? Learn from here
Infosys Stock Price action Trading in a Tight Range

Infosys is now trading in a tight range between 1100.00 – 1050.00. From the perspective of lower time frame, Market does offer opportunity as price swings will appear larger on Hourly or Minute charts. But trading within these tight ranges is not a good bet, since it reduces our positive expectancy rate.
A Nice explanation about Positive expectancy through Technical analysis
Structural High of the range is 1100.00 and structural low of the range is 1050.00. Traders should watch these levels to asses the market direction, if stock breaks out on either side. Also there are two different possibilities from here. Either Price action will breakout upside or downside by moving beyond the structural levels. On the other hand, Market might continue the correction by expanding the range.
Stock Market Offered Clues Before the Breakout
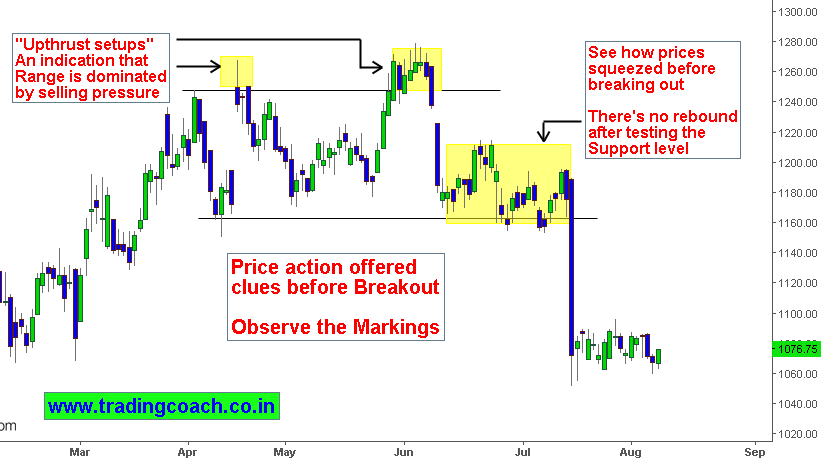
Price action offered clues even before the Q1 announcement. We can spot the signs of Distribution, when share prices were oscillating in a broad range during April – June. Smart money players were successfully pricing in the effects of dampening fundamentals.
Up thrust setups during April and June, indicates the domination of selling pressure. Even with multiple attempts price action couldn’t cross the resistance level 1250.00. Bearish Price swings were larger than bullish price swings. Stock prices squeezed before the breakout, Price action didn’t rebound after testing the support level 1150.00. These were the signs of upcoming downfall.
Trapped traders and Expectations
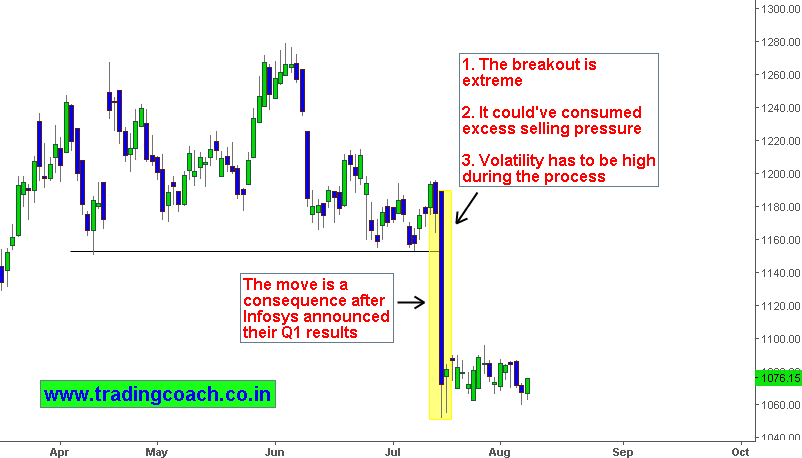
The breakout of support level 1150.00 was extreme and could’ve consumed excess selling pressure. Momentum during the breakout is large and as result volatility spiked resulting in strong bearish candlestick. The movement happened after infosys announced Q1 results. Price action must have shaken out weak hand players during the movement.
Learn about breakouts in relation to breakout failures
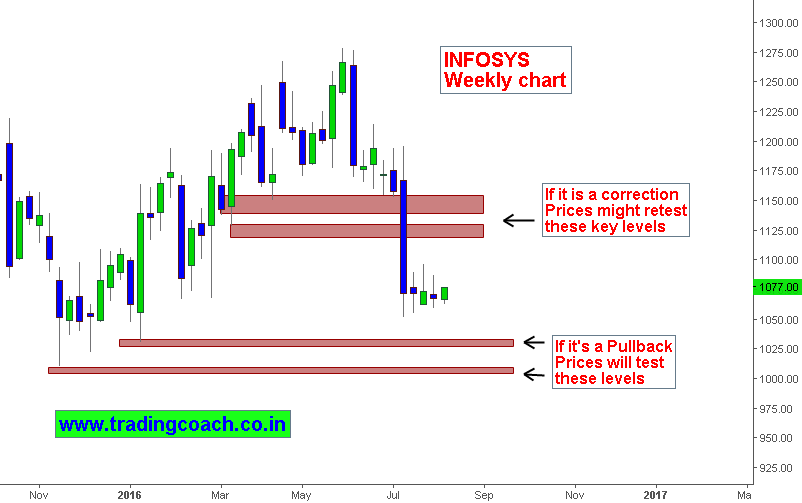
Resulting price action can be either correction or Pullback. If it is corrective, expect prices to rise and retest earlier support levels such as 1150, 1125 etc. If it’s a Pullback then expect market to test key levels such as 1025, 1000. Focus on Price behavior.


