

Crude Oil was trading in an optimistic sentiment after IEA forecasted that markets would balance and stabilize in coming months. MCX crude oil bounced back after touching 2615.00, a previous support level on the month of May 2016. Current structure shows possibility of a Pullback pattern, yet there are circumstances where pullback can result in failure, especially if there is uncertainty in Market sentiment. Many traders think Oil prices may trade in a range for next few weeks. Traders should focus on Price action and formation of market structure.
Crude Oil Showed Signs of Distribution Phase
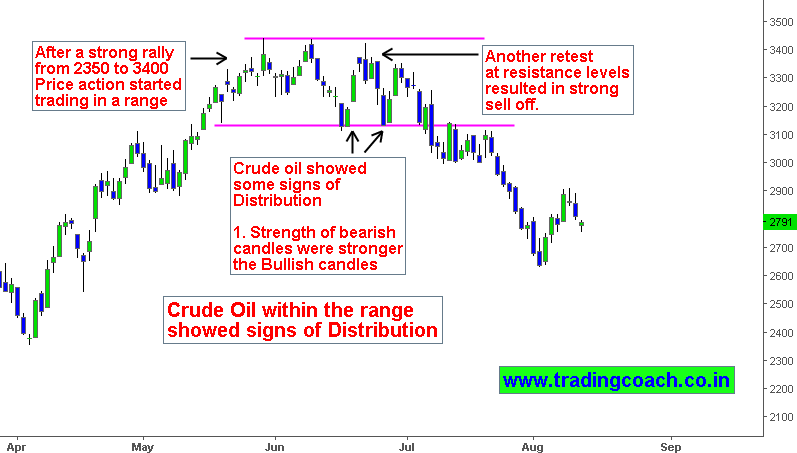
After a strong rally from 2350.00 to 3400.00 during April–June, Market tested 3450.00 and started trading in a tight range then. Within the range, Crude Oil showed signs of distribution such as strong bearish candles, increased volatility and rising momentum of bears. The attributes coincided with events and stories focusing on supply glut. The strength of the Bearish candles were stronger than the bullish candles. Finally a Retest at 3400.00 during the month June triggered the selloff which eventually led to breakout of 3115.00.
Price Action Bounced After Touching Support Level 2615.00
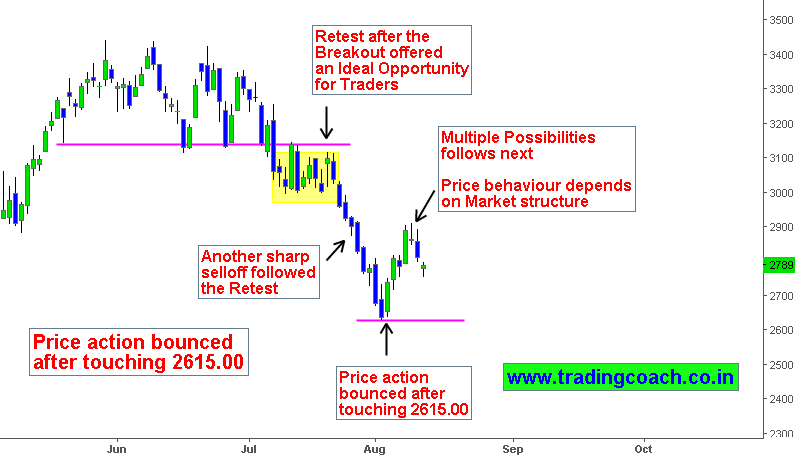
Crude Oil retested the previous support level 3115.00, which was an ideal opportunity for traders. Another sharp selloff followed the retest caused by influx of selling pressure. During the process US Crude oil inventories report showed a stellar rise in production levels. The movement continued until 2615.00. Price action bounced back after touching 2615.00. The result is Pullback formation – There are multiple possibilities on how this might turn out.
MCX Crude Oil Market Structure and Trading Setup
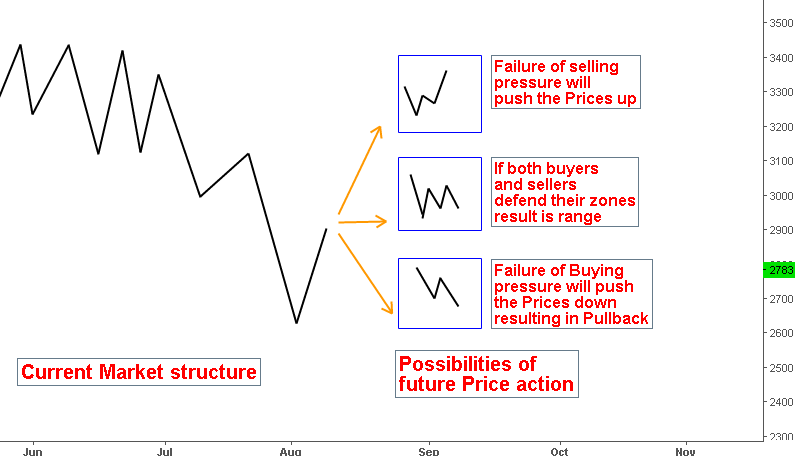
The Pullback formation can turn out into multiple variations as mentioned on the price chart. But three different possibilities stand out from the rest. We can gauge which one of these might workout based on how price action reacts after testing support and resistance levels on lower time frame. The Important key levels to focus are 2630.00, 2910.00, and 3000.00. Also watch out for Important events and information.


