

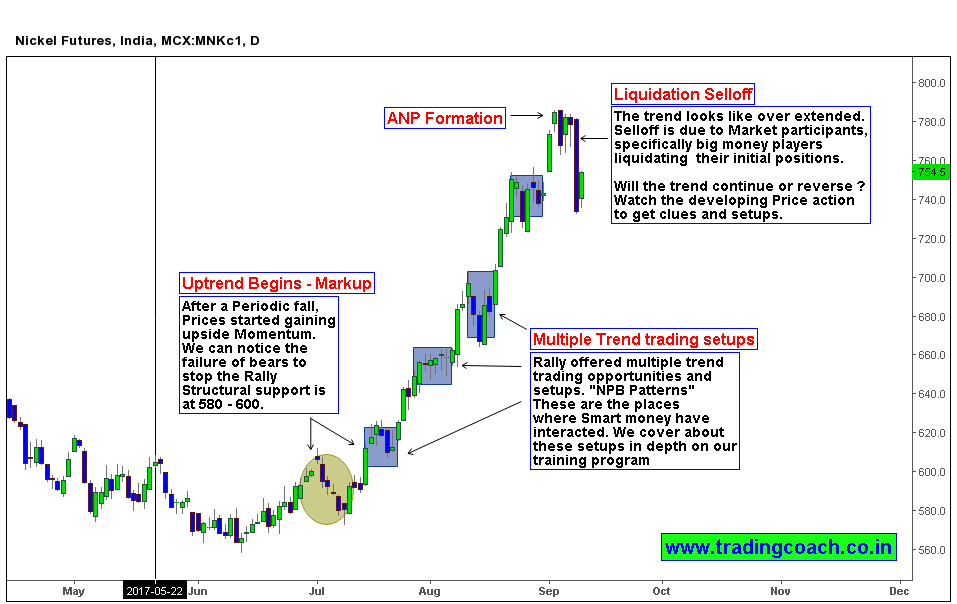
Geopolitical jitters influenced Institutions to park their liquidity into Base metals and other safe heaven assets. Nickel is one of those assets that benefited from “run to safe heaven behavior”. Nickel prices rallied from 575 to 790 during the period of June – September (within 5 months). The Uptrend we are witnessing in daily chart is an Intermediate trend (spanning from weeks – Months) as per Dow Theory.
Recently Price action is showing signs of over extension, the selloff we are seeing in daily chart (especially the big blue candle) is larger and volatile than previous corrections and consolidations that happen as part of a trend. The main reason behind the selloff is liquidation by market participants, especially big money players – Though it’s not obvious in daily chart, we can spot their activity and involvement in lower time frame. We cover the technique of Identiying Big money activity in our premium course
You can also notice that many indicators have not shown any signs of trend exhaustion, but price action is suggesting us to stay cautious. This is a good example to point out the edge price action offers compared to lagging indicators.
Will the uptrend continue or reverses? For answer, we need watch the developing Price action in coming weeks. I am expecting the Prices to correct or go into sideways, but the main obstacle is geopolitical flows, if it continues to influence the market action then prices might rise again. As a Price action trader, I don’t predict – instead I would try to catch good directional trades.


