

Nifty’s price action is trading within short and stubby range. Market movements didn’t have much activity this week. A review of weekly price action on lower time frame shows some interesting developments. ECB’s monetary policy statements and Oil prices influenced investor sentiment resulting in weak participant rate on Market structure. Current Price value of Nifty is 7899.30.
Below is the 1h chart of Nifty covering this week’s price action
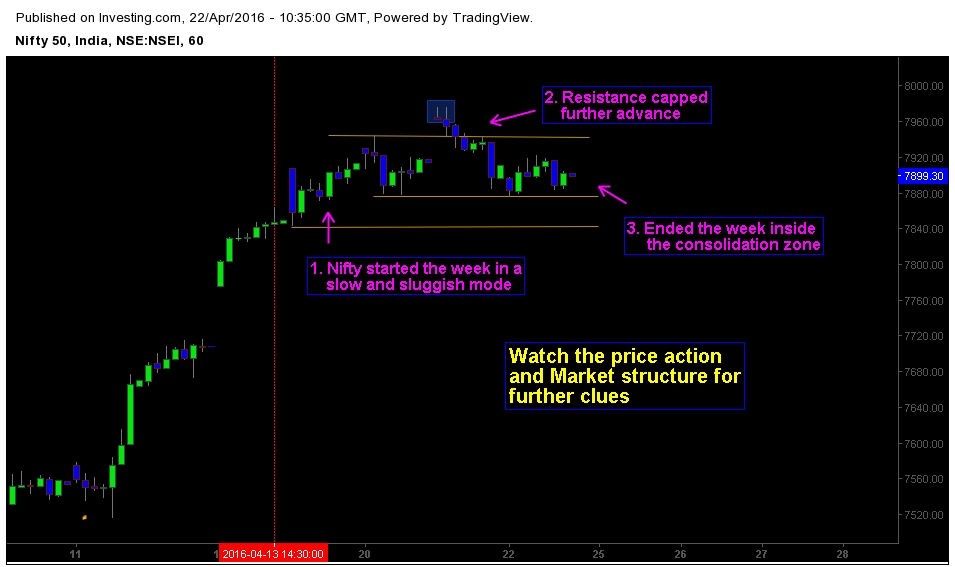
1. Nifty started the week in a cautious way.
Price action was slow and sluggish which revealed the mindset of market participants. As I emphasized several times market’s opening price action provides more information about future price movements throughout the time period. Nifty rose from 7856.00 to 7970.00 during the first half of the week.
2. Resistance level at 7945.00 resisted further advances.
Minor resistance level at 7945.00 capped further advances of Nifty price action. Market again tested the key level which resulted in selloff from 7975.00 to 7875.00. This indicates that sellers exist at resistance zone. To keep up the buying pressure Nifty price action should break the key level in a clear way.
3. Market ended the week inside the consolidation zone between 7840.00 and 7945.00.
Nifty ended the week in uncertainty due to low volatility pressures and less participation rate. Nonetheless Nifty price action has formed some interesting market structure which can offer further directional clues about future price movements. Traders should focus on key levels at 7840.00 and 7876.00. Also keep an eye on price action and market structure.


