

Price action is getting trickier in Nifty and becoming harder to extract the information. This seems like the game of algorithms to trap the bulls. Back in my institutional days, we call these kind of movements as “pool hunting”.
As the name implies, these price action moves happen in order to trick smart traders into the wrong side. I mentioned in my last article, that long-term structure is bearish corrective and upside moves are limited. Now you can see why the long-term picture is very important, even for short-term traders. Unless and until you’re a scalper, it’s not prudent to ignore long-term price action.
Read about long-term market structure analysis here …
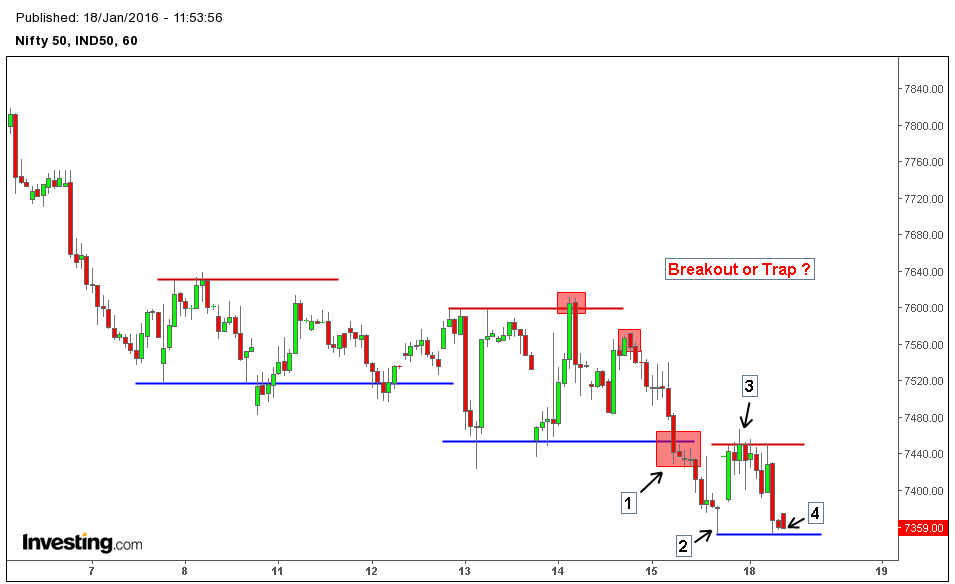
1. At key level 7440, we had a murky breakout which indicated less participation in the selloff, most likely driven by weak hand players and dumb retail traders
2. When price action touched the key level 7350, Nifty rebounded which provoked a wrong conviction that market is moving upside. Some market participants could’ve initiated buy orders at this point, hoping to catch another upswing inside the volatile range.
3. Selling pressure came back when price action tested the previous breakout level 7440. At this point sellers defended the price level, nifty followed a sell off until 7350. It shows that sellers are willing to defend the resistance level.
4. This is where it gets interesting; price action indicated that bears are in control. But after seeing the market structure, I am quite cautious in believing the inference. Of course, through normal technical analysis – it becomes obvious to see the selling pressure gaining upper hand, especially the breakout pattern, would tempt anyone to short the nifty in short-term.
I launched a critical swing analysis into the recent market structure, to get complete picture of Nifty’s Price action. Here’s the result of swing analysis.
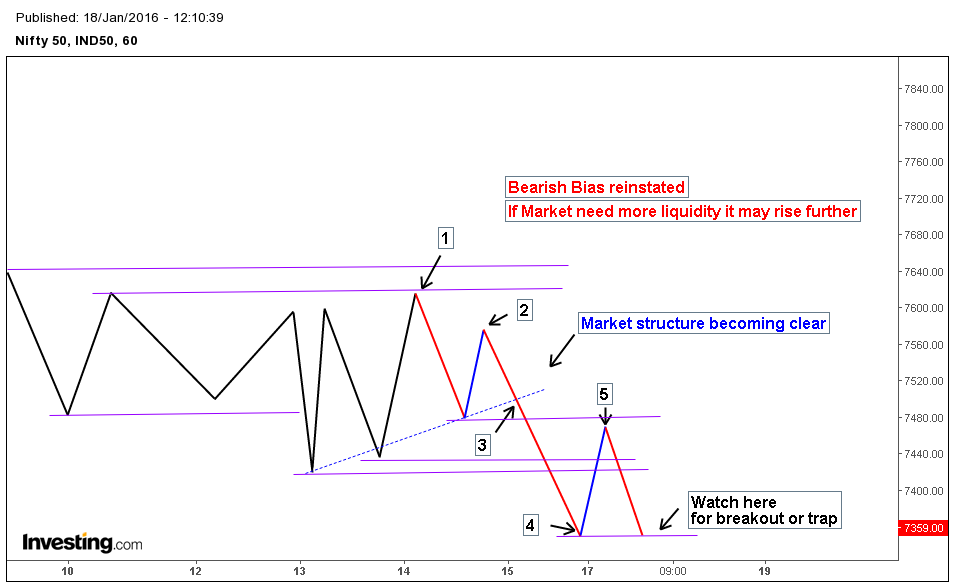
1. After hitting important resistance level at 7625, Nifty sold off until 7500. The key level 7500 became an important zone due to the convergence of other factors, such as short-term bullish trend line and earlier swings lows.
2. Nifty bounced from the level 7500 till 7570, then something strange happened, a new influx of selling pressure absorbed the buy orders and tricked both strong and weak players. This happens when floor traders, get confused.
3. Resulting in a breakout at 7500, later turned into a large selloff and created a feedback mechanism while reinstating bearish bias. Market structure became clear, after the selloff. Trapped bullish traders started liquidating their positions, as a result price action dropped until 7350.
4. Nifty rebounded from 7350, and tested the breakout zone at 7500 – this indicated the bull’s willingness to buy at bottoms. But, most likely these bottom pickers are none other than weak hands and retail traders.
5. Price action fell from the breakout zone 7500, which indicated that bears are willing to sell at higher resistance and supply zones. In order for us to confirm the strength of selling pressure, we need further evidence of Nifty’s price action
Track the price action at 7350, and wait for further clues. My focus is on the resulted breakout pattern, and to confirm whether it’s actually a breakout or another trap (throwback perhaps). This helps to confirm or reject my short-term trading bias.


