

Most of the financial sector stocks experienced good movement in the last few weeks. Specifically the major components of Bank nifty such as HDFC Bank, ICICI Bank witnessed drastic rally of their share prices. But one of the most anticipated stocks – Yes bank, failed to impress investors.
Despite attractive valuation and reasonable earnings, the price movement was more or less lagging behind. Even though Yes bank share prices rallied from 186 – 280, the movement is nothing compared to other Banking and NBFC stocks.
Yes Bank Price Action Analysis on Daily chart
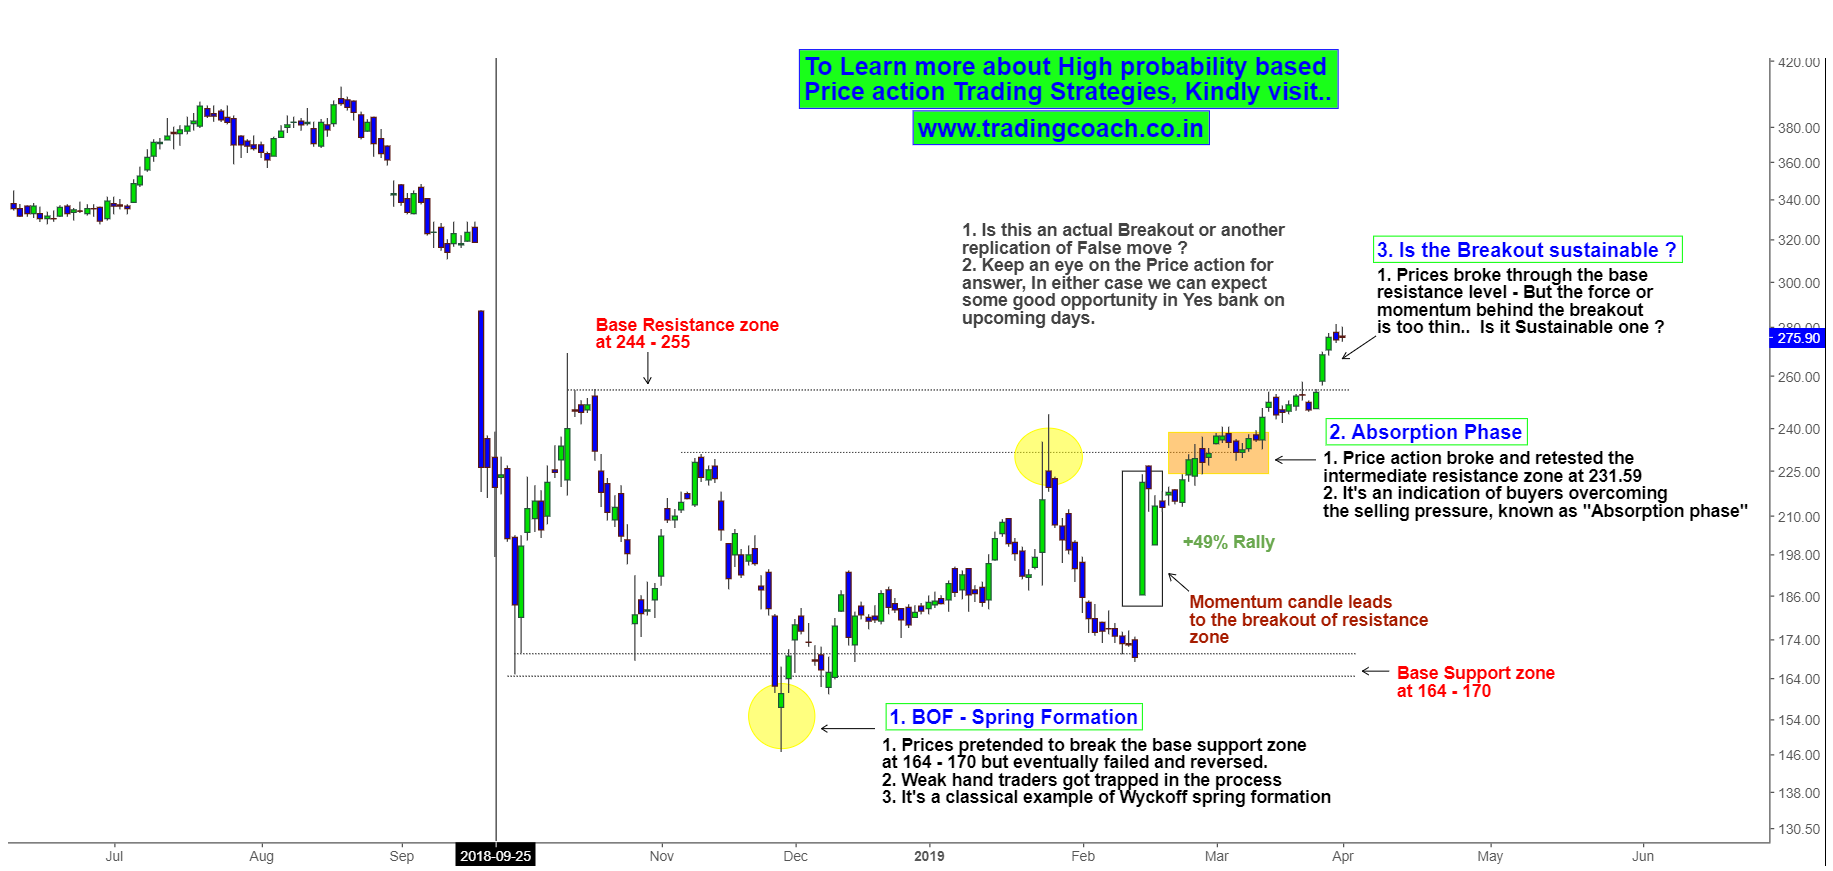
But the most interesting fact is, even though share prices rallied with less momentum – it has broken the long-standing resistance zones. Price action broke and retested the intermediate resistance zone at 231.50 in the mid of March. Followed by that, again price action broke the base resistance zone at 255 at the end of March.
Why is this so important? The share prices were struck in a range of 164 – 255 for almost 6 months, recent breakout indicates the possibility of a new trend. But the caveat is – force or momentum behind the breakout rally is too thin (Look at the size of the candles around breakout in the chart)
Is there a possibility of this recent movement turning into a False Breakout? Keep an eye on the Price action for answer. As of now two possibilities exist – It can either become an actual breakout or transform into a false breakout. In both cases swing traders can expect some good opportunity on Yes bank in upcoming days.


