

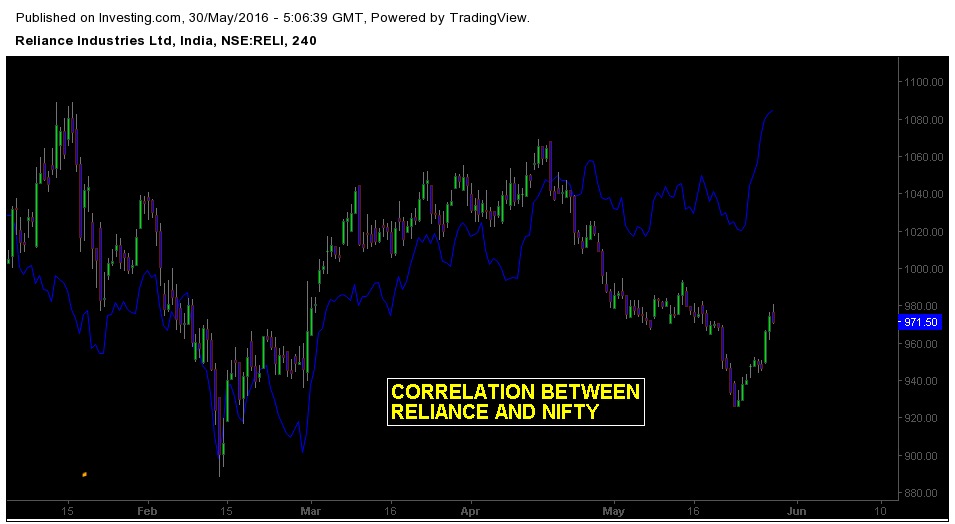
Reliance is one of the most active stocks from last couple of days. When relatively compared with Nifty, the price action of Reliance is quite odd – frequently converging and diverging back and forth with the index. From the perspective of News events Reliance Industry’s plan to drill 21 wells in four offshore will impact Investor sentiment. Current price value of Reliance is 973.40.
Below is the correlation chart of Nifty and Reliance Industries
Price action analysis in Reliance industries on 4h chart (Ideal timeframe for short-term traders)
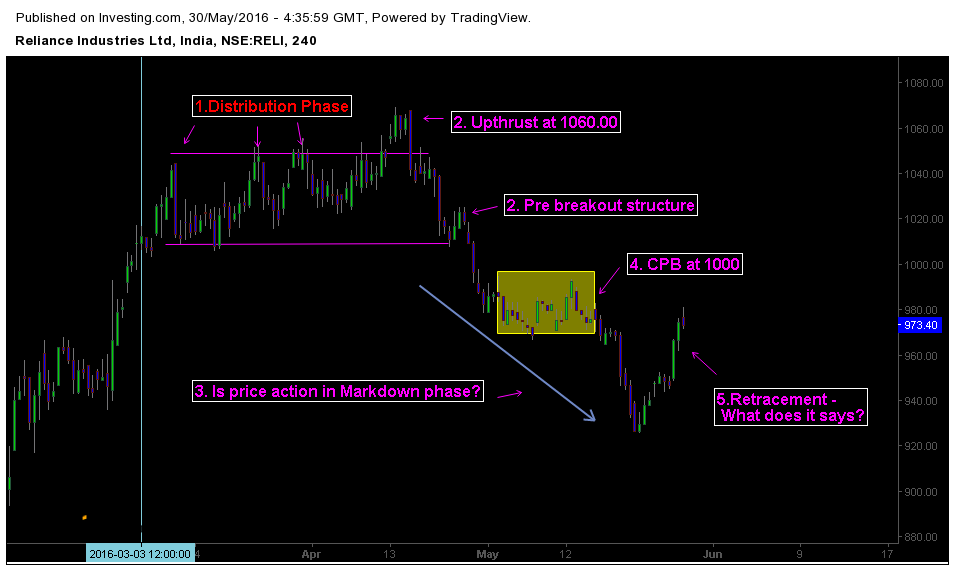
1. Market briefly traded in distribution phase
Between 1050 -1000, Price action traded in distribution phase. Several tests at the resistance level followed penetration failures confirm the thesis. Wyckoff cycle provided an ideal framework for analyzing the market structure. Shadows of projectile candlesticks at resistance level 1050 indicates the volatility experienced by traders.
2. Up-thrust at 1060.00 followed by Pre-breakout formation at 1000.00
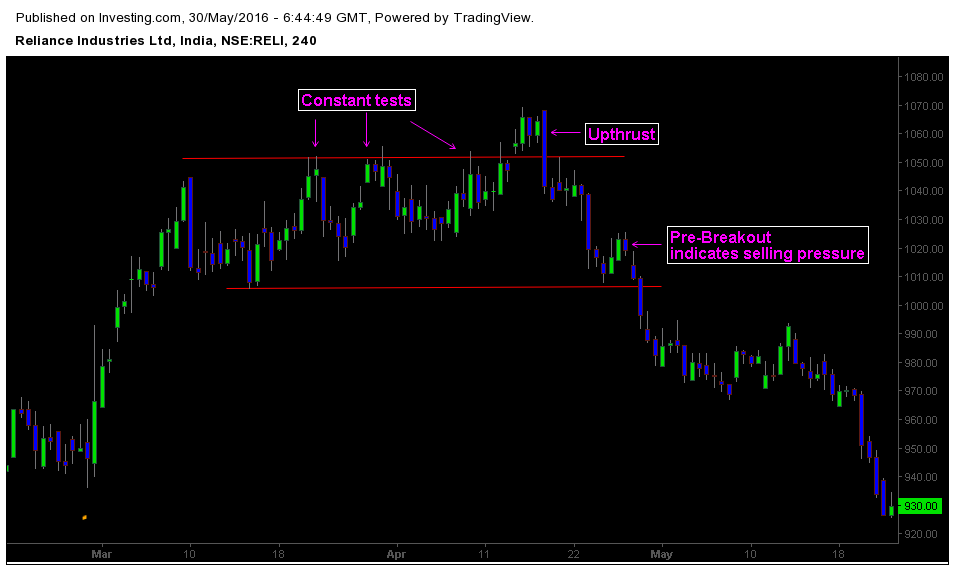
Another point that confirms our view is the up-thrust at resistance level. It indicates that price action failed to push above 1050-1060 zones. Impulsive selloff followed the up thrust in a strong way. This movement shows the influx of large orders which is visible as strong candlesticks. Pre- breakout formation at earlier support level 1000.00 points out the momentum of selling pressure.
3. Are we in Markdown phase?
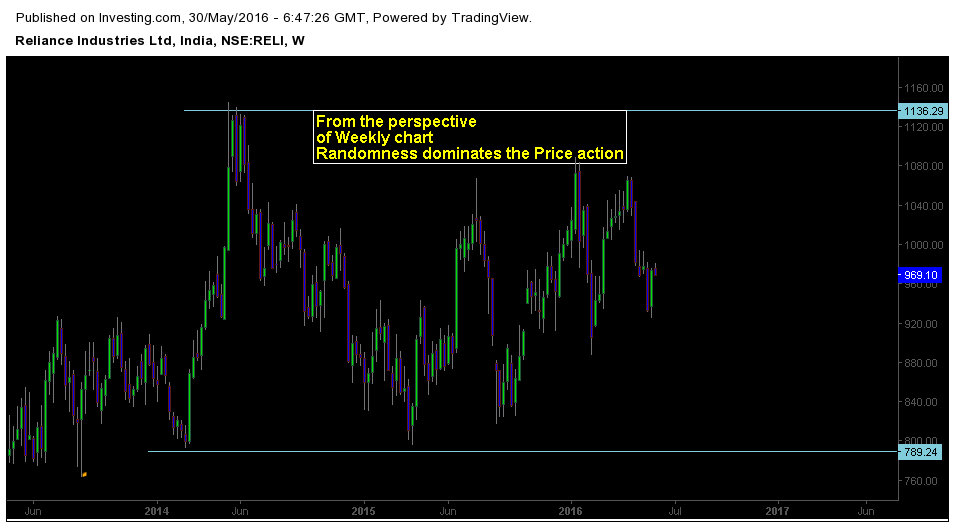
When we look at the chart, it’s easy to make a snap judgment about the market phase. But to confirm our views on structure, we should rely on higher time frame price action. From the perspective of weekly chart reliance is trading in a random environment. By combining the context of both weekly chart and 4h chart we can say that price action is in markdown phase, but it can also change the direction or move into temporary equilibrium.
4. Congestion Pullback at 1000 radar level
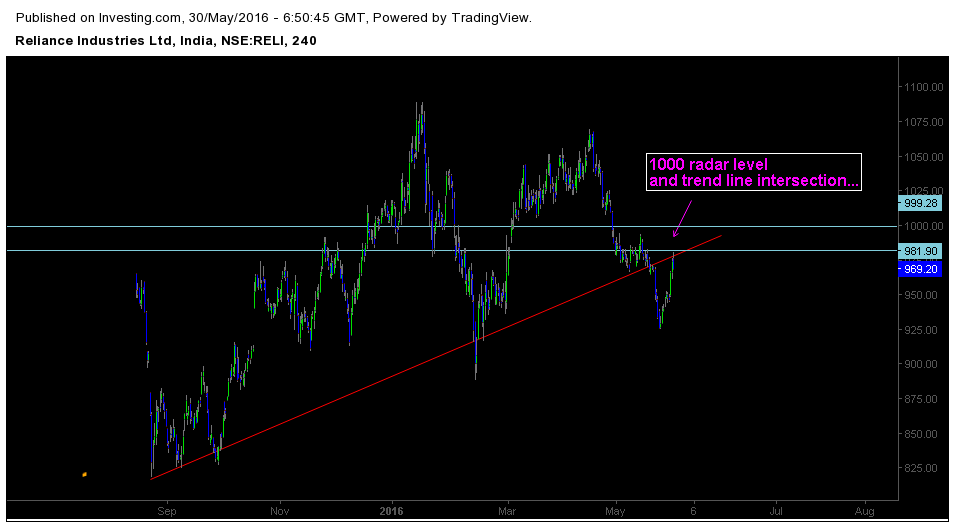
Price action technically formed a congestion pullback at 1000 mark. There are few important features we can notice about this key level – First it’s a well-known round number, so market participants will track it closely and second, it’s also a structural trend line from the perspective of higher time frame so there’s a possibility of price imbalance at this key level. Traders should check how price reacts at this level.
5. Price action have formed a retracement pattern.
Currently price action has formed a retracement pattern on 4h chart. Traders should focus on how price behave after the pattern. Retracement is a double-edged setup it can mean both structural termination and continuation. To get a better gauge of market sentiment, we should see how price reacts after this. Also keep an eye on important economic reports and news announcement which will affect investors perception.


