

Reliance is one of the very few blue chip companies where trends are quite predictable, easy to spot and analyse. Since from Nov 2017, Price action is trading roughly within a range of 100 points (970 – 870). It’s quite easy to see the range structure in Daily chart, respective key levels are – support zone at 890 – 875 and resistance zone at 970 – 980.
Reliance Shares Price action on Daily chart
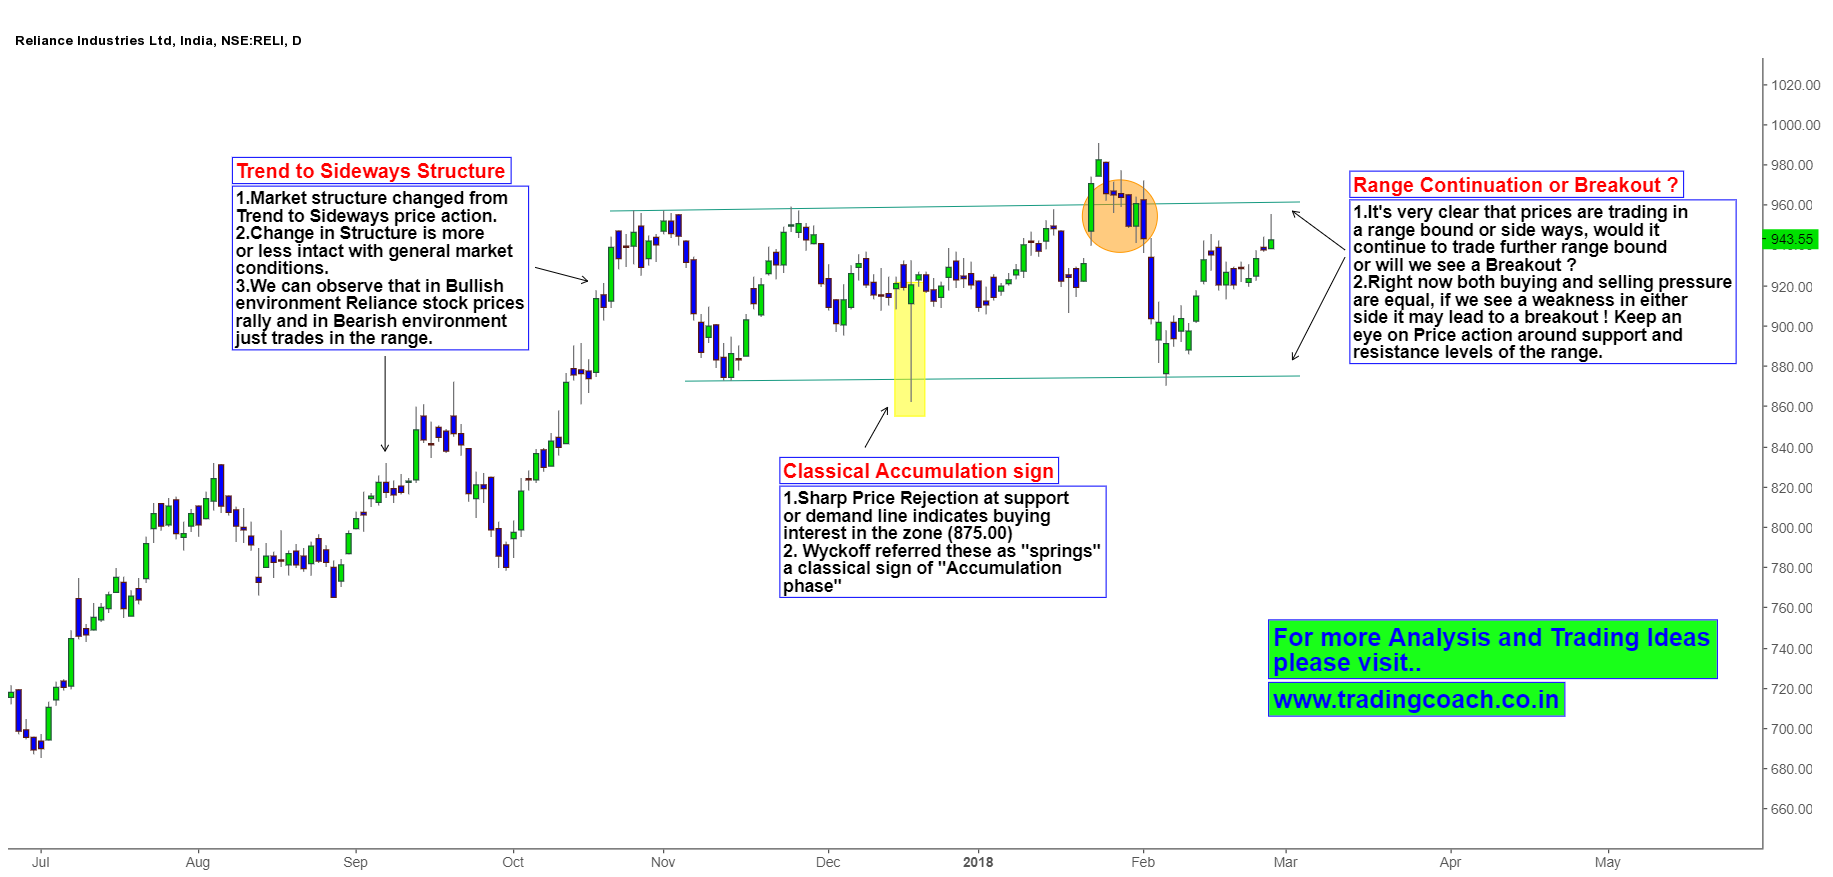
Reliance Stock prices have a repeating behavioral tendency to trend higher when nifty is bullish and to trade sideways when Nifty is bearish. Simply put, the relative strength of Reliance shares is better and Intermarket relationship of Nifty – Reliance has positive correlation. Therefore general market conditions of Nifty have a wide impact on Reliance Share prices. But if Nifty tumbles, Reliance shares just trade sideways because of Promoters intervention.
Another interesting point is Classical Wyckoffian spring formation at support zone of the range (I have highlighted that candlestick with long shadow in the chart) Technically it indicates the smart money players and their buying interest at lower prices similar to an Accumulation phase. But keep in mind as I have pointed out before, not all accumulation phases will be successful some can even turn into outright failures!
Right now it’s very obvious that prices are trading in a range – but would the range continue further? Or will there be a breakout? Should we expect traps and false breakouts in the short-term? For insights and Trading setups keep an eye on developing Price action and Trade accordingly.


