

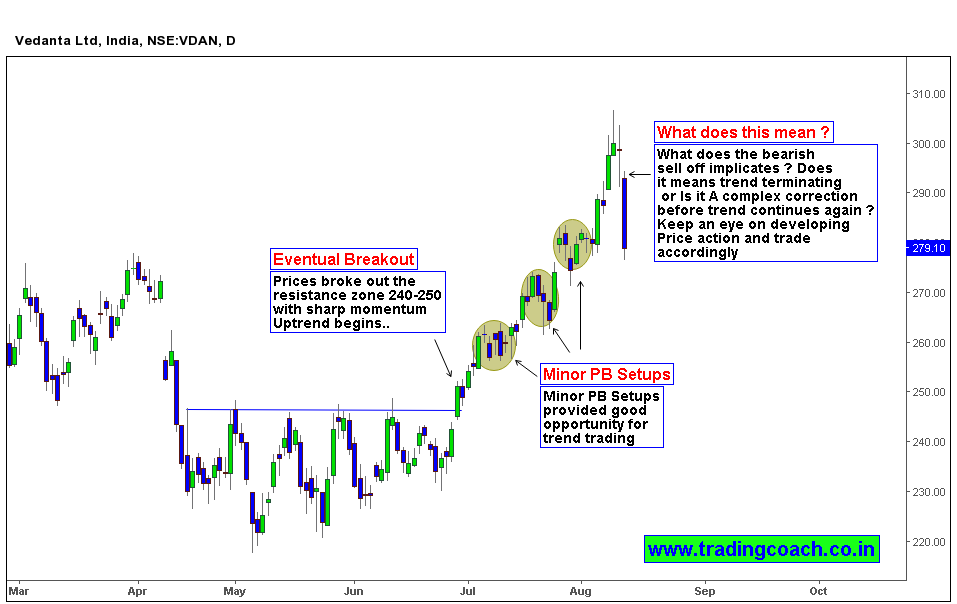
Vedanta Share prices rallied from 240 – 300 during the period of July to August. The movement correlated with general direction of Nifty 50 as a typical bull market. From April to July prices were in a range between 220 -240. Price action broke out the range high 245 in July and started trending upside; the inflow of buying pressure was due to the impact of GST and Quarterly reports.
Even though the Price rally lasted only for 2 -3 months (technically a short-term trend as per Dow Theory) Trend gave multiple Price action setups and trading opportunities on both Higher and lower time frame. Minor PB setups on Daily chart offered excellent spots for trend traders to time their entries.
The recent Bearish selloff (large bearish candlestick noticeable on daily chart) is casting a shadow on the bullish trend. Is the price action suggesting that trend is going to terminate? Is it a complex correction which is going to result in Future trend continuation? It’s necessary for buying pressure to sustain for continuing the bullish tone; if not we might see a range or selloff. Keep an eye on developing Price action and trade accordingly. Vedanta can offer good opportunity in coming days, Put it on your watch list


