

TCS share prices are trading very close to the structural resistance zone. Price action is on a Range bound or sideways Market structure. After failing to break the high at 3300 in Feb, shares saw some moderate correction. Prices tumbled from 3300 to 2800 within two months. This move is the precursor for trend reversal, as a result market structure changed from Trend to Range. The Price behavior which preceded the structural change and recent market conditions are clearly noticeable in TCS Daily chart.
TCS Price Action Analysis on Daily chart
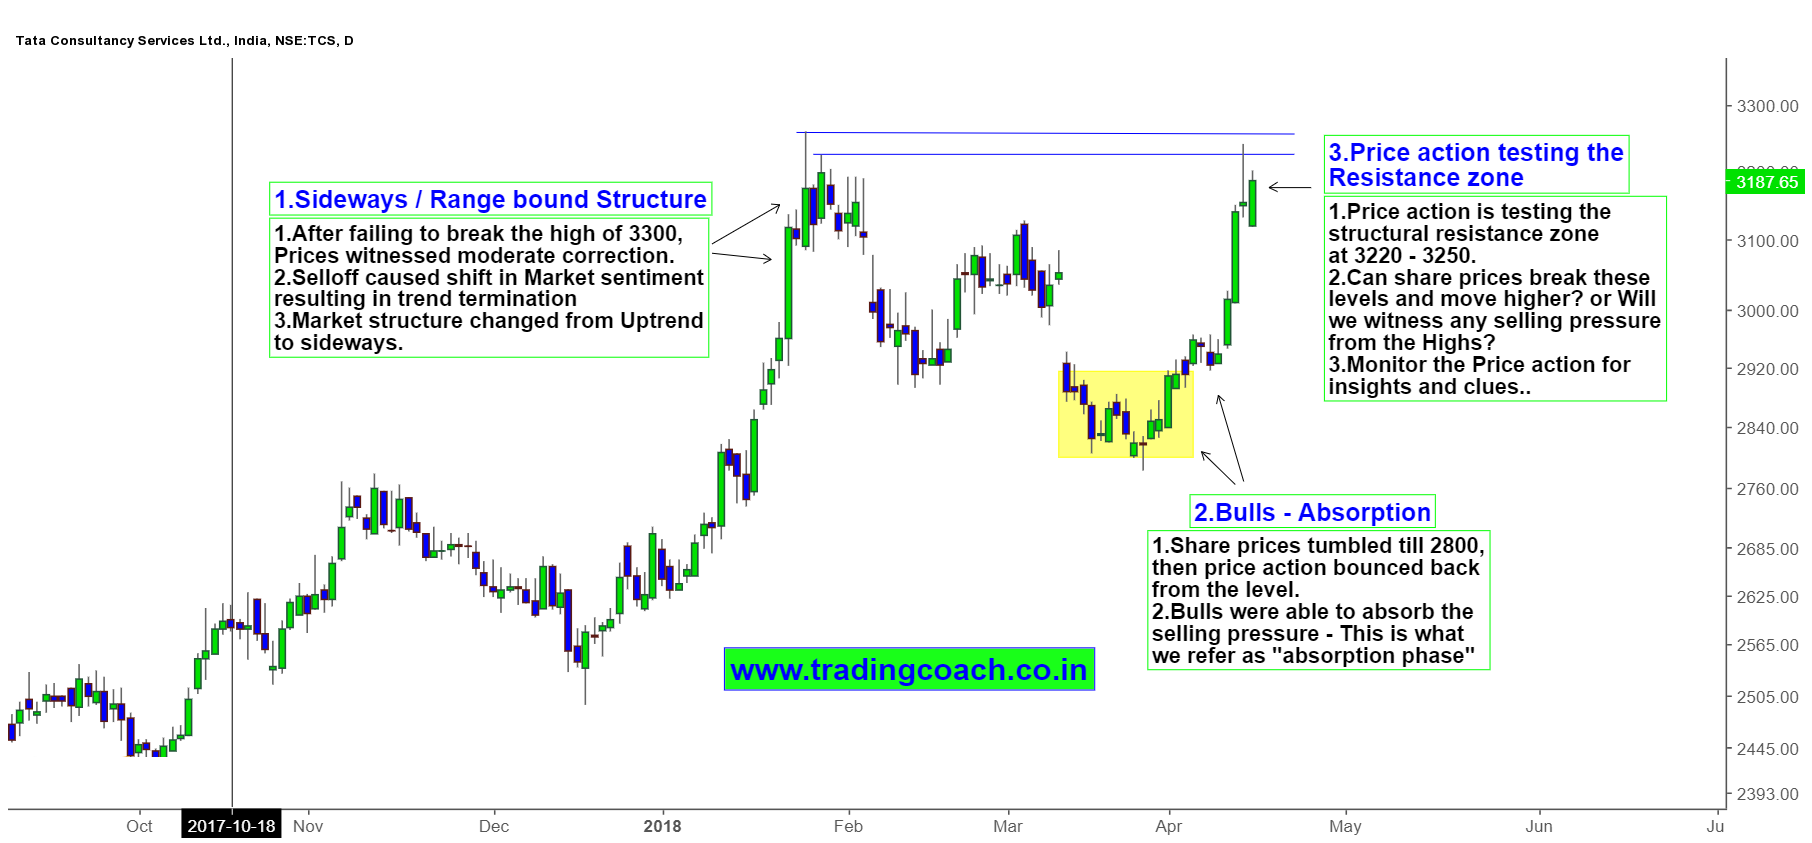
After touching 2800, Share prices rallied higher with strong buying pressure. This unexpected Price movement is clearly visible on the chart. (I have highlighted it with yellow marks) Technically, the level had good buying interest therefore bulls were able to absorb the selling pressure with ease. Richard Wyckoff would call this type of market behavior as Absorption phase.
After bouncing back from low, prices rallied higher and now once again testing the structural resistance zone at 3220 – 3250. Can share prices break the zone to move higher? How sellers are going to react? Will we see any selling pressure from the resistance? Traders should watch the Price action in coming days for clues and insights. Trade only when there is a proper setup with strict risk management.


