

We can Observe a sharp downside breakout in Yes Bank (NSE: YESB) daily chart, market prices retesting near the broken support zone 340 – 350. Top private sector bank stocks took hit after government unveiled PSU recapitalization plans; YES Bank is one of those shares that tumbled right after the announcement. Though it’s not the only reason for YES Bank’s sluggish performance, the sharp downside breakout also coincided with RBI probe and fine on Yes bank for misreporting NPA’s.
PRICE ACTION ANALYSIS ON YES BANK STOCK CHART
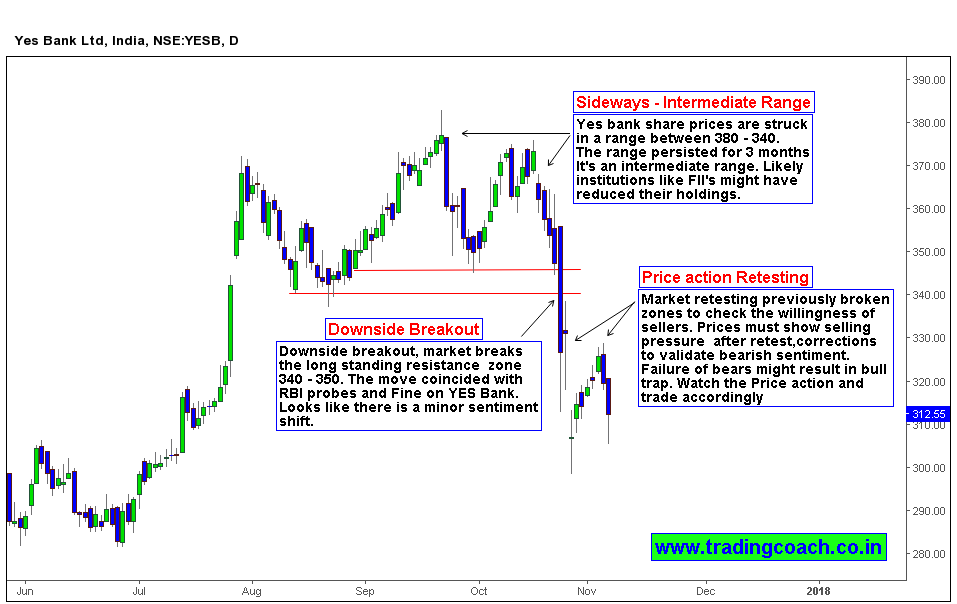
Yes bank share prices were struck in range between 380-340 for last 3 months; eventually prices broke out downside at the end of October from long-standing support zone 340 – 350. Technically it’s an intermediate range (if we see it from the perspective of Dow Theory), so institutions like FII’s might have reduced their holdings in the range, similar to Wyckoff’s distribution phase.
Currently we witness Price action retesting near broken support zone, looks like market prices are testing the willingness of sellers. We must see good selling pressure after retest and minor rallies to confirm bearish sentiment. If we can’t witness any selling pressure it may turn out as a retest failure or bull trap. Traders must watch the Price action and take trades accordingly with proper risk management. Positional traders and swing traders can expect good opportunity on Yes Bank in coming days.


