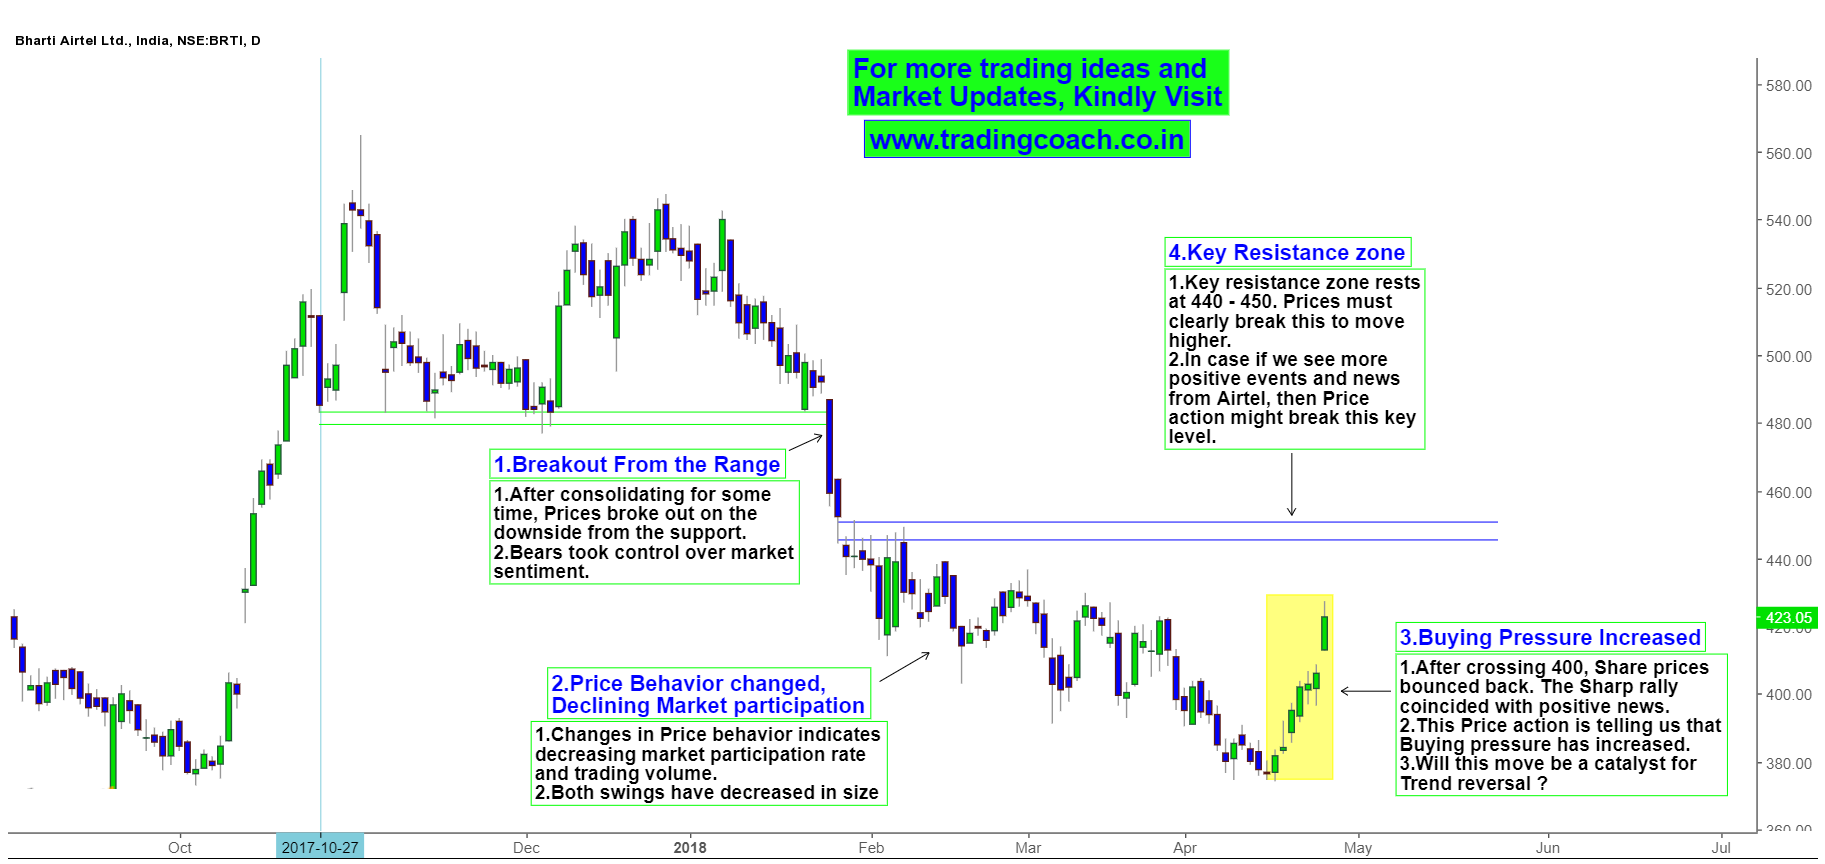
From last couple of Days Airtel shares rallied consistently. Share prices bounced back from 375 to 430 with decent momentum. Recent Price action might indicate the changing structure and market behaviour. The sharp upswing that we are witnessing on the chart is posing a threat for the earlier downtrend. Price action analysis on Daily chart of Bharti Airtel clearly demonstrates the scenario.
Bharti Airtel Price action Analysis on Daily chart
Since the beginning of this year, Sentiment was Bearish. Share prices tumbled from 550 to 370 in a period of 4 months. The downtrend started at the Breakout in the end of Jan. After consolidating for some time, prices broke out on the downside from the support zone at 500. That marked the beginning of Downtrend. In the month of March, overall trading volume started to decline. Price behaviour radically changed where both upswings and downswings decreased in size. This was a sign of reducing liquidity and market participation rate. From the perspective of Richard Wyckoff this is a failure of selling pressure.
After crossing 400, bears lost the momentum and Share prices bounced back. This sharp upside movement from 375 to 430 coincided with positive rumors about Bharti Infratel merger with Indus towers. Will this Price action continues further? Can it turn into cataclysm for Trend reversal? The key resistance zone is at 440 – 450. Prices should clearly break the resistance zone to trend higher. In case if we see more positive news and rumors from Airtel, then Price action might break the key resistance zone. Traders should keep an eye on Fundamental events and rumors from Airtel, also must watch the Price action in Daily chart.


