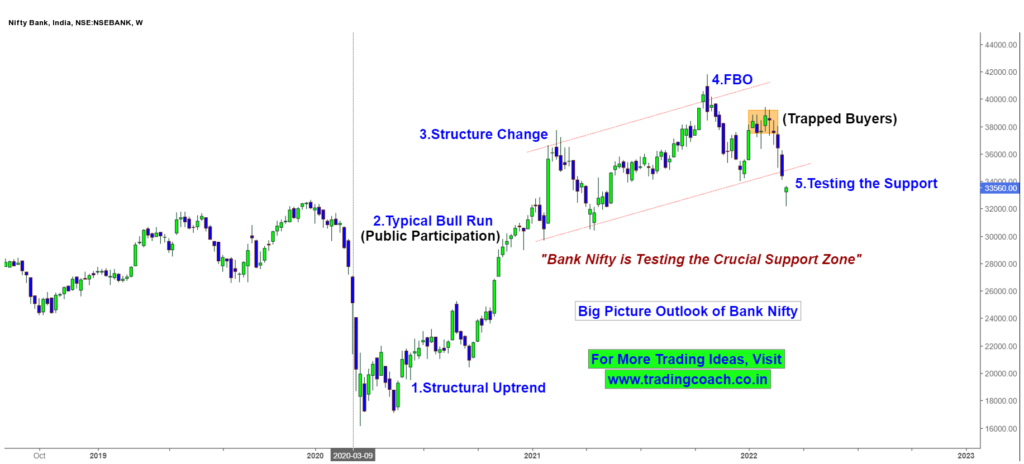
Bank Nifty – Volatility, Confusion and Price Action! Big Picture Outlook
Bank Nifty’s recent Market Behavior and Volatility is extremely confusing for most of the traders and Investors. Lower time frame Price Action is filled with noisy fluctuations, Traps and Price Gaps. To Get a Better Clarity of the Price Action, Let’s take a look at the Big Picture on 1W chart of Bank Nifty. Bank […]
Bank Nifty – Volatility, Confusion and Price Action! Big Picture Outlook Read More »