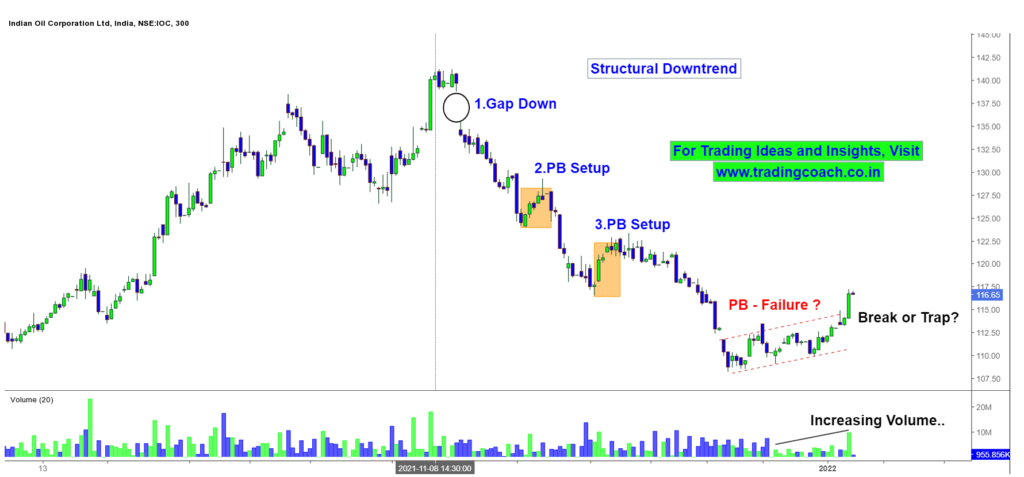
IOC or Indian Oil Corporation Stock prices were out of the spotlight for a long time. But recently the Stock prices shot up by almost 7%, after testing the lows at 110. Based on the Market Behavior, it’s interesting to see the current Price Action of the Stock
There are some signs of Trend change and sentiment shift. Take a look at the Price Action Analysis on 5h Chart
Indian Oil – Price Action Analysis on 5h Chart

Prices are in a Structural Downtrend. Shares have fallen from 140 to 108, within a Month. Traders should pay attention to Market Sentiment, as most of the shares are recently driven by the Sentiment shift without any underlying causes.
We can see that PB Price Action Setups have worked out very well in the past. Each time, we saw a PB Setup, Prices kept falling down. It worked out very well as a Trend Continuation trade.
But now for the first time, PB Setup has failed to make a new low. In fact we are seeing the opposite reaction; Prices have broken the recent highs. Is it an Indication of a Trend Change? Or will this turn into a Bear Trap?
Another Interesting aspect is the Increasing Volume from the last few days, Rising Volume Indicates more order flow entering into the stock, which can be a precursor for a sharp movement.
Important Resistance zone is around 123 and Prices must break the zone to rally higher. Likewise important Support zone is around 108, Prices must break the zone to fall further.
Traders should keep an eye on the Price Action and Market Behavior in upcoming days. The Stock might give good opportunity on either on the Upside or Downside. It’s worth to keep it on the watch list!
