So far, the steel sector is not looking good from last couple of weeks.
Just like Tata Steel, about which I have discussed in the previous article, SAIL is another steel company which is experiencing a lot of turmoil in the Stock prices.
SAIL’s share value has so far declined around -53% from its peak value.
Buyers who bought the shares at the peak valuation of 130 – 150 are trapped in the market.
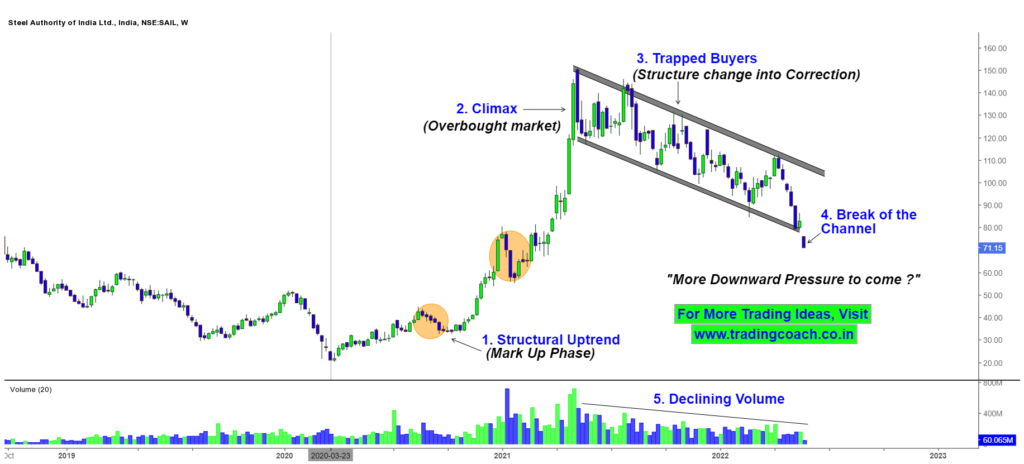
Take a look at the Price Action of SAIL on the weekly chart.
SAIL Price Action Analysis on the Weekly Chart

We can clearly notice the Market transition from Trend to Range, Structure has changed into a correction on the weekly chart.
Right now, prices have broken the low of the channel, it doesn’t look good for the Buyers. Prices have broken the prominent support zone at 80.00
Based on the recent Price Action, it seems like more downward pressure is likely to follow up on the Stock.
In order for the prices to go up or turn around, we need to see a strong upside momentum. But, as long as the General market sentiment is Bearish, we can’t expect any strong turn around in the Stock Prices.
Traders should keep an eye on the Price Action and take decisions as per the Market sentiment.
To understand more about the Price Action Structure and Trapped Traders in SAIL, take a look at the Video link given below.