ICICI bank was the most active stock from past few days. Higher time frame price action is in downtrend and market structure analysis reveals some important information. It’s obvious to note that price action is trading in consolidation ranges on lower time frame. From the perspective of Wyckoff, it’s technically a Trend tester Pattern in Big picture. Current Price value of ICICI bank is 237.00.
Below is the Price action analysis on ICICI Bank over daily chart – It reveals some interesting information about Market structure.

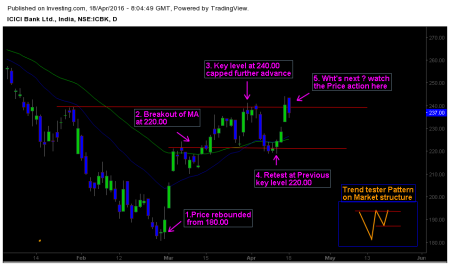
1. Market Rebounded from key level 180.00.
Market rebounded from 180.00 after touching the key level. As we can see in the chart, the bounce is strong and sharp caused by influx of buying pressure due to liquidation or positioning factor. This particular move took place in the beginning of March, which was also a turning point in Nifty.
2. Price action broke 25 period and 50 period EMA.
Price action eventually broke the Moving average at 220.00 which marked a shift in market sentiment over lower time frame. Intraday traders could’ve perceived this move as climatic patterns on lower time frame. But price action stagnated after crossing 230.00.
3. Resistance level at 240.00 stopped further advances
Previous Resistance level at 240.00 capped the market advances. It indicates the presence of sellers at resistance zones. Price action should break these resistance zones in a clear way to prove the strength of buying pressure on ICICI Bank.
4. Market retested the previous breakout level at 220.00.
Price action came back to retest previous MA breakout zone at 220.00. This move could’ve trapped out weak hand players. When we watch the structure more closely, it also resembles Breakout Failure formation on Lower time frame.
5. Price action testing the Resistance level again at 240.00.
Market is once again testing the Resistance level at 240.00. From a Big picture perspective ICICI have technically formed a trend tester pattern. (It’s a pattern identified and named by Richard Wyckoff) For more clues and trading opportunities traders should on Price action at 240.00, also keep an eye on higher time frame market structure.
Very Good explantion