Here’s the Point by Point Price Action Analysis on Bank Nifty for the week, to make sense of the Price action outlook and big picture.
Take a look at the chart analysis to understand the references and gather ideas.
Bank Nifty Price Action Analysis on 1D Chart

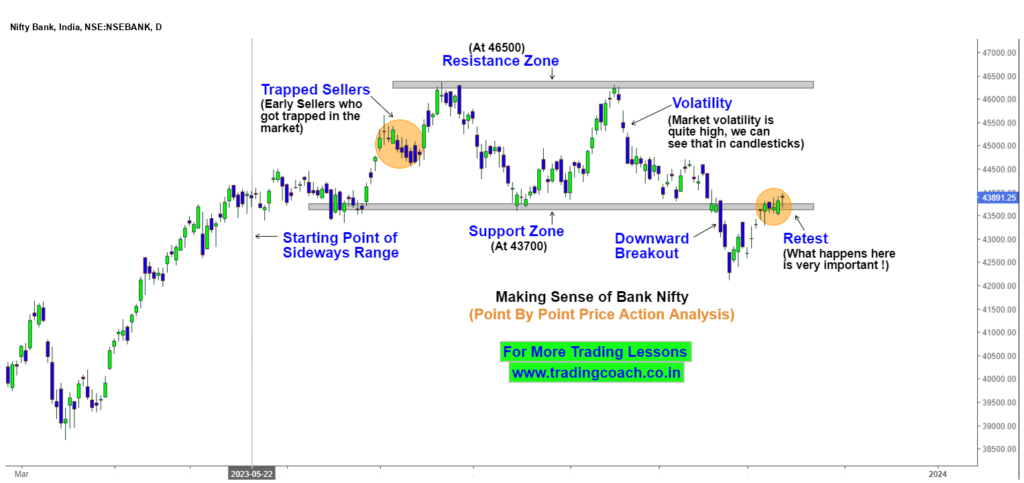
1. Starting Point of Sideways Range
Bank Nifty started its sideways journey from here. Recognizing this phase is crucial – it sets the stage for potential market shifts, giving us a heads-up on where the market might be headed.
2. Trapped Sellers
Early Sellers who got trapped in the market – those who got in early and found themselves on the wrong side of the market. Understanding this dynamic gives us an edge, as it often signals potential reversals in the Price Action
3. Resistance Zone at 46500
Bank Nifty faces a resistance zone at 46500. This level is more than just a number; it’s a psychological hurdle. If Prices test this Resistance, it could lead to an upward push or a reversal.
4. Support Zone at 43700
We’ve got a solid support zone at 43700. This level acts like a safety net for traders. If Prices test this support, it could lead to either potential bounces or breakdowns.
5. Volatility is quite high
The market’s volatility is reflected in candlestick patterns. Understanding the volatility and we may need to adjust our stop loss placements and strategies accordingly when we trade.
6. Downward Breakout
Bank Nifty has broken out of its sideways trend, heading downward. Selling pressure was quite strong during the Breakout
7. Retesting the Breakout Area – What happens here is very important!
Price Action is now retesting the Breakout area. A successful retest may lead to a strong downtrend, whereas a failure could point to a false breakout.
What’s next from here?
Just FYI, I am an individual trader, not a SEBI registered advisor. This article is for educational purposes only. I am sharing only my view. So do your own analysis and always take calculated risks.
Keep an eye on the Price Action at the Retest Area and trade accordingly. Even though markets look bullish on Lower time frame, it can change any time due to high volatility.
To learn more about Price Action Trading concepts and lessons I have discussed here, checkout the free course in the video given below.
Since there’s not much clarity in Price Action, I will wait for a few more candlesticks to get a better idea of what’s likely to take place.


