
Technically, Gold is trading in corrective market structure. Large shadows and decreasing volatility are pointing out less conviction behind price movements. Price action is squeezing the resistance zone at 1280 -1287. Current value of Gold is 1276.11 as per international spot market. Global economic situations and Federal Reserve are on the tab of Gold Investors. Any news events from US FED can have a signpost on Price action.
Below is the 4h chart of Gold with Price action technical analysis
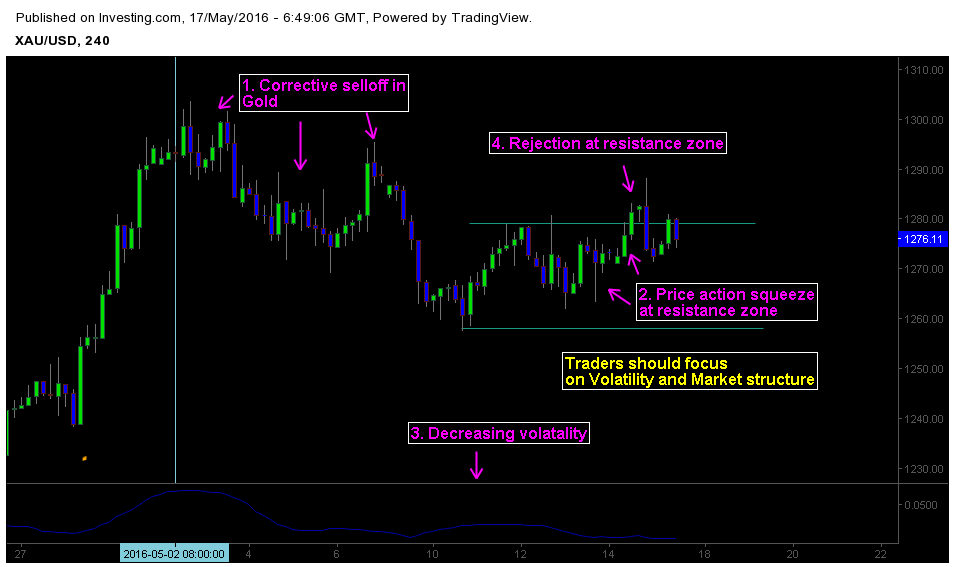
1. Market is trading in a corrective structure.
Looking at the daily chart, we can infer that price action is trading in a corrective context. Corrective moves are choppy, congestive and random. Recent selloff we saw in gold was a corrective movement, as price action is both random and congestive. A large Bullish candle within the bearish context confirms our perspective. The corrective selloff began after price action retested the resistance level at 1300.00 in the beginning of May.
2. Price action squeezing the resistance zone
The most interesting development within this structure is the squeeze around the resistance zone at 1280. Price action tested key level three times; it indicates two different things, conviction of sellers to defend resistance zone and willingness of buyers to test the key level. Resulting price action can offer important clues on future market sentiment.
3. Decreasing volatility shows less participation.
Volatility can show more information about liquidity and positioning factor within the market structure. Decreasing volatility means recent movement in gold has less participation rate. It also means less liquidity and lower conviction on price action. To get a better gauge on market sentiment, we need to see how price action moves to rising volatility.
4. Price Rejection setup at Resistance zone.
We can spot a price action setup at resistance level 1287. Price action traders refer to this pattern as rejection pattern. It signs the obsessiveness of buying pressure to stay above the resistance level. But we need to take this setup with a pinch of salt, as present market conditions and volatility measure didn’t match the probability criteria. Price action trading is not about trading patterns, it’s about understanding the market psychology that shapes these patterns.
Traders should focus on market structure and volatility measurement to gauge market bias and sentiment. Also keep an eye price action at important areas.