Since from the Year it got listed, till to date, IRCTC Stock Prices have seen excellent ups and downs.
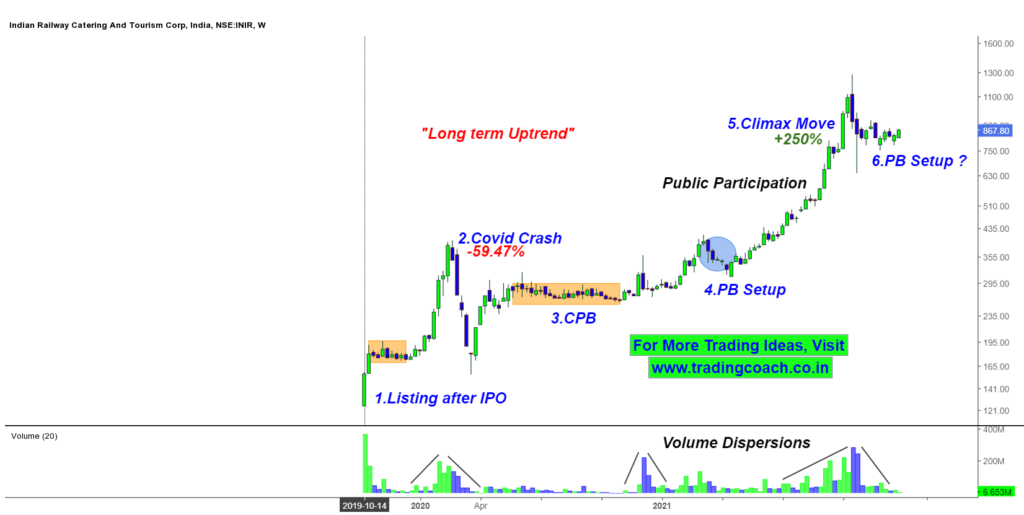
The Stock Prices have rallied all the way from 120 to 1000, which is almost 10 times from the Listing Price. After testing the highs at 1300, IRCTC Share Prices retraced from the all-time high and now it’s trading around 860.
Even though Market participants are concerned about the Volatile Price Action that’s taking place from last few months, the long-term trend is still intact on the Stock Price.
Take a look at the Price Action Analysis on the 1W Chart

One of the important things we can notice is the Long term trend in IRCTC Stock Prices. We can see the chronicles of how the shares have performed so far since from the day it got listed.
Right now we can see a PB Setup in Price Action. When market formed a similar setup in the month of Mar – Apr 2021, Share prices went on to make new highs.
Respective Intermediate Support is around 775 and Resistance is at 930. If Prices break the Resistance with good buying pressure, Shares can touch the next potential resistance around 1100.
On the other hand, if support cracks due to selling pressure, we are going to see 725. Either way, we are going to see increased volatility and momentum in Stock Prices on upcoming weeks.
As we head onto the year-end, Traders and Investors should check the stock prices of IRCTC on Weekly time frame. Perhaps this is an important chart we need to keep in mind!


