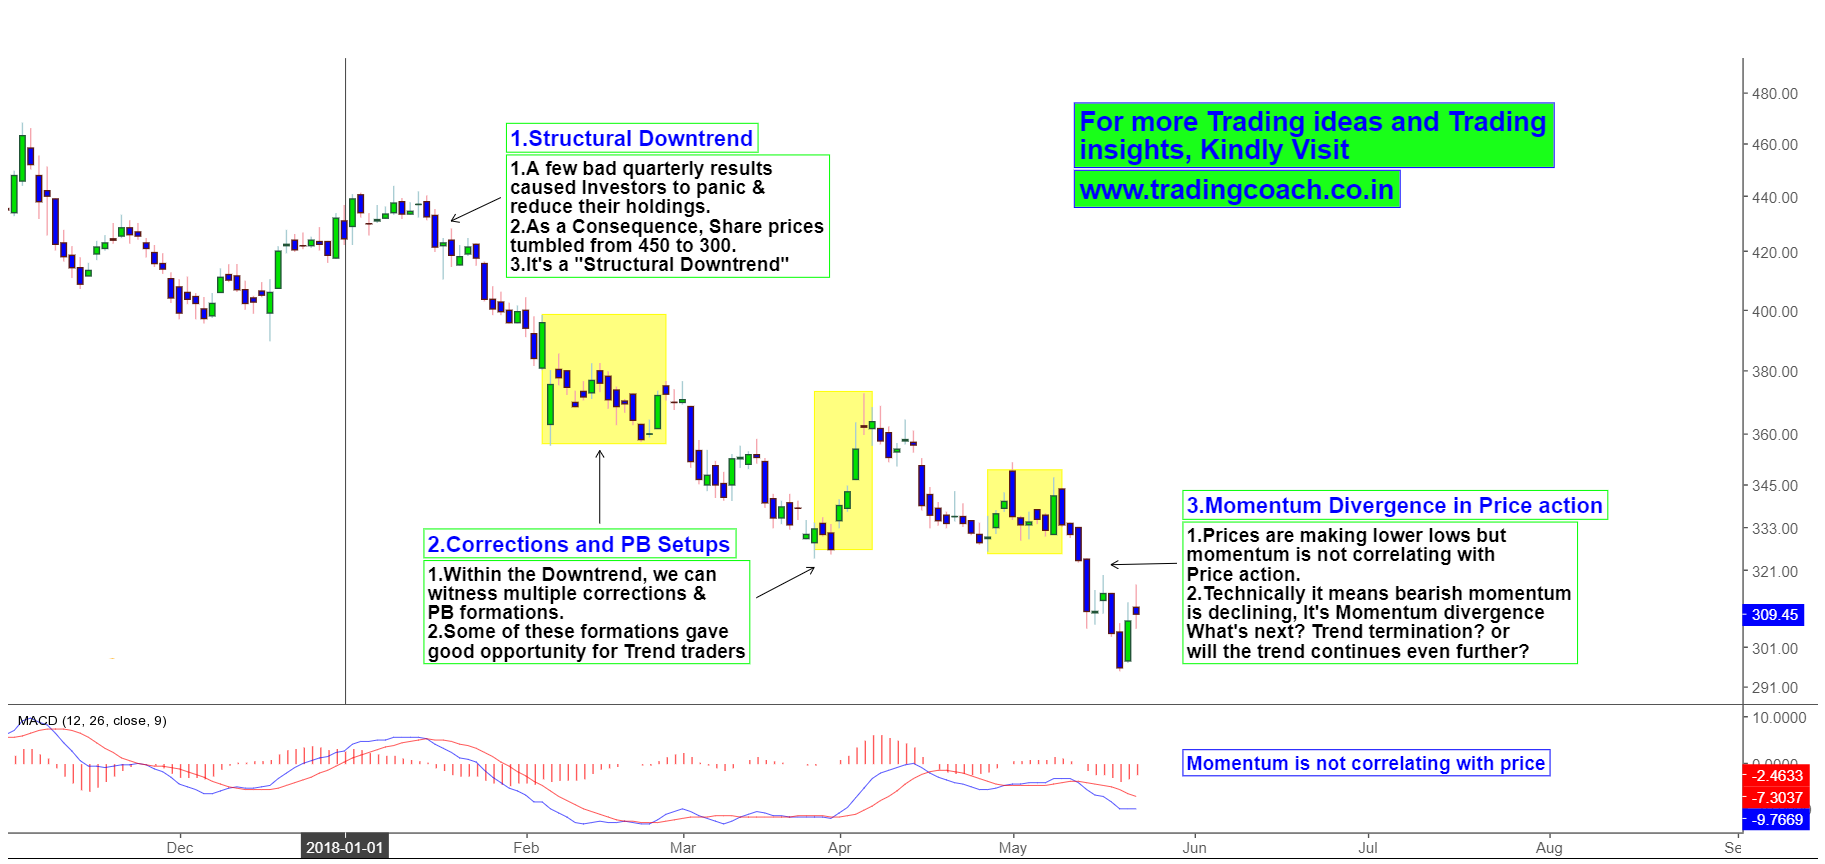
Momentum should precede the trend, changes or shift in Momentum can indicate weakness of the trend. It’s seems like that’s the case in Tata motor Share prices. Downtrend in daily chart of Tata motors is reflecting a shift in Momentum, as measured by MACD. On the side note for Price action traders, I am not a big fan of Momentum Indicators such as MACD, ROC etc. But they can be used as supplementary tools in trend analysis. Here’s the current Overview of Share price.
Tata Motors Price action Analysis on Daily chart
As usual, the downtrend in Tata motors started with constantly disappointing Quarterly results. We all know that markets are irrational! Just 2 or 3 Disappointing Quarterly results are enough to cause panic among Investors. Soon Share prices started to tumble from the high of 430 and trading close to 300. Based on the perspective of Dowtheory, it’s an Intermediate Downtrend.
Within the Downtrend, there were multiple corrections, retracements and Pullbacks. We can consider them as constant interruptions of Counter trend traders. Especially investors and stake holders who assessed the intrinsic value of Tata Motors might have stepped in to stop the declines, which didn’t work out. These formations also gave excellent opportunity for trend traders – one could’ve initiated position in derivatives, based on these setups.
In the current outlook, Market structure is still in Downtrend but momentum is not correlating with Price action. We can see this clearly with MACD (Experienced Price action traders can spot this just by looking at the price chart without the help of any Indicator). Technically speaking, it’s a momentum divergence, which means bearish momentum is declining. There are two possibilities which could happen – 1) Trend might terminate and prices can bounce back or 2) Market sentiment can influence the price action, Trend continues even further. Keep an eye on developing Market structure for answer. Tata motors may take the spotlight in coming weeks.

