HCL Tech Stock Prices rallied almost 10% in the last few days. Price Action broke the Important Resistance Zone at 1200 and went up all the way till 1280. After testing 1280, Prices are retracing back.
What we are seeing now is a good example of an Upside Breakout and a retest followed by that. Take a Look at the Price Action Outlook on 4h Chart of HCL Share Prices..
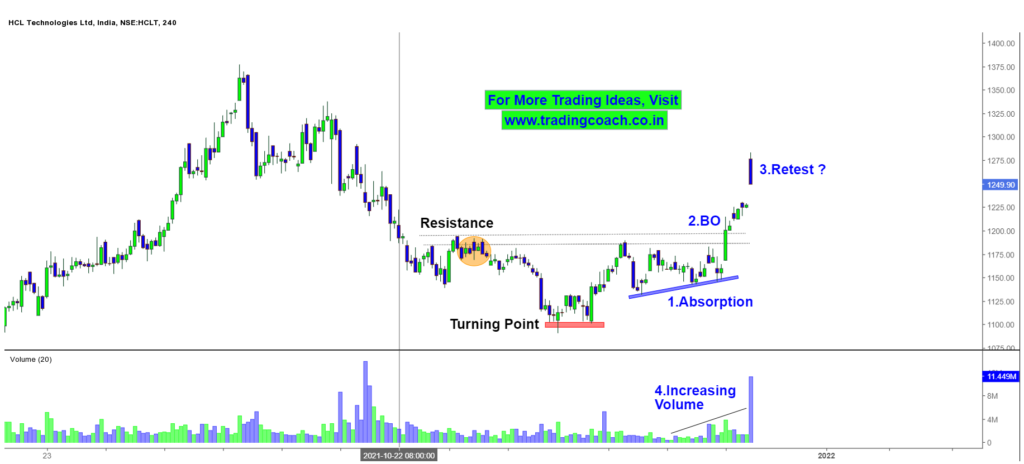
HCL Tech – Price Action Analysis on 4h Chart

Volume is increasing from last few weeks, which indicates Higher trading activity and Big Orders coming into the Stock. So we can expect some good movement on the Stock in upcoming days.
If Prices retest the Breakout Zone at 1200, it can act like a Potential Support and if price action continues to move higher, Potential Resistance is around 1320, which can hold the rallies.
Traders should watch the Retest in Stock Prices. If Selling Pressure increases, Retest will fail and prices will fall back into the Range. If Retest is successful, Upside Momentum will continue and Prices will rally higher.
Keep an eye on the Price Action in 4h Chart and trade accordingly