I am pretty sure most of you’re aware of High frequency trading or simply known as HFT. Incase if you’ve not heard about this terminology before; let me explain this for you. High-frequency trading (HFT) is an automated trading process used by large investment banks, hedge funds and institutional investors that utilizes powerful computers to transact a large number of orders at extremely high speeds such as in microseconds or nanoseconds.
In simple terms, HFT is an automatic trading system used by big players and financial institutions to do scalping trades with high-speed. For example, within a fraction of 5 -6 seconds, an average HFT system would’ve done 1000 trades!
Now if you’re a retail trader thinking to do the same thing with basic computer using some laymen amibroker code through your broker’s platform, it’s going to backfire! To be honest you need have highly advanced computers and large capital along with strict regulatory license to get into High frequency trading. It’s simply out of reach for normal traders.
But when these HFT’S engage in the market, their activity tend to create certain formations or structures on the price chart. With the help of Price action and volume, we can find these formations and trade them to capture some decent gains from the Market.
Why is this important?
Most of the time, the structures that’re created by the activity of High frequency traders and algorithms can be utilized like a trading setup. You can find the formations created by these HFT traders through price action and use them to take directional trades. For example: Here’s a simple HFT Trading formation – I call it as Compressor.
Compressor Formation – High Frequency Trading Price Action Structure
1. Characteristic of the Compressor Formation
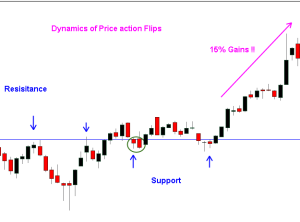
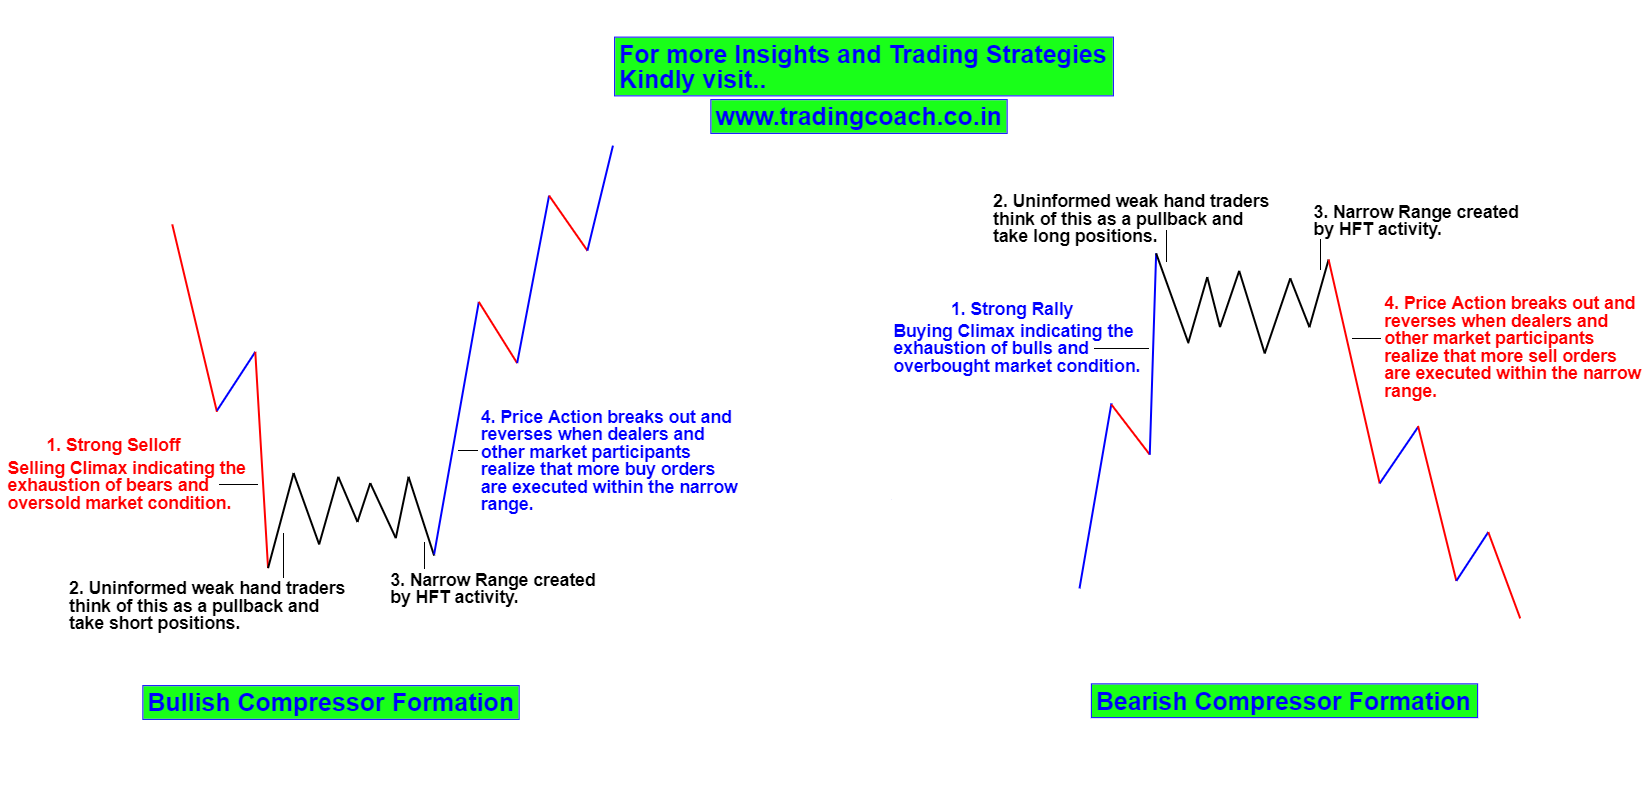
After a strong rally or a strong selloff, price action will start to trade in a narrow range and prices will fluctuate within a tight boundary. Volume might spike up during the previous fall or rally but later reduces to a normal level. Most of the time, weak hand traders will perceive this as a range and place orders around support and resistance. But once price action begins to move swiftly from the range, these weak hand traders will be trapped and forced to exit from their trades.
2. Logic behind the Compressor Formation
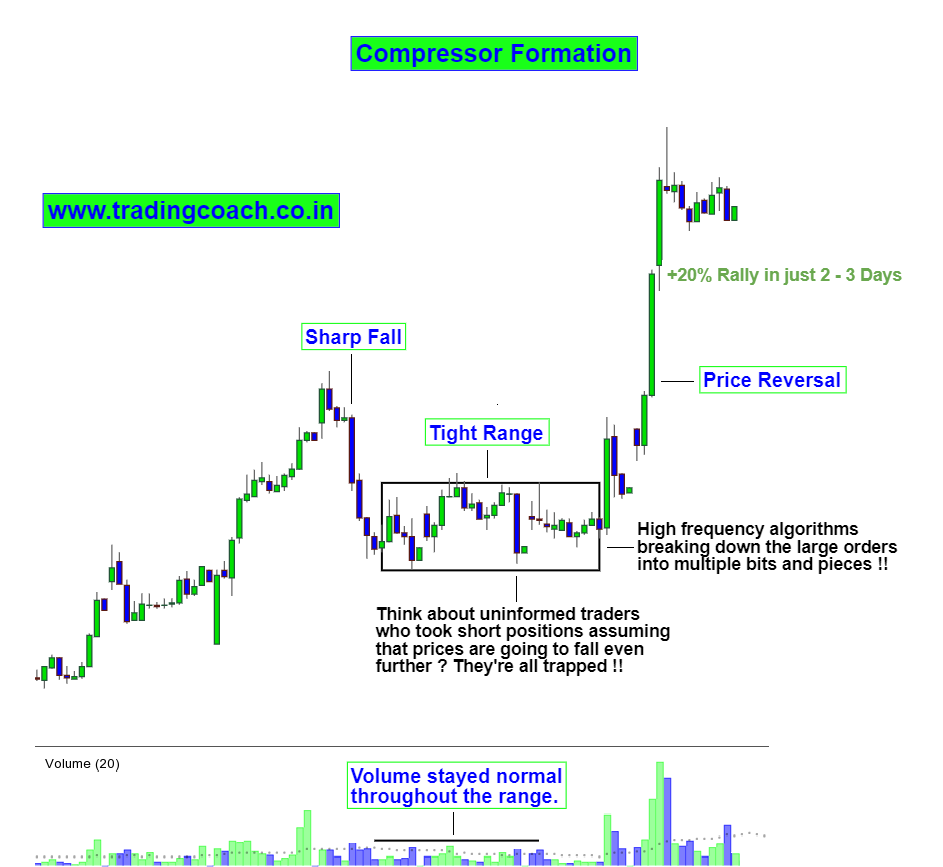
This is an interesting formation created by the activity of Big money players using sophisticated HFT program. Often these big players will trade in large quantities. In order to get a better price and hide their large orders from other market participants they use specialized High frequency trading algorithm.
This algorithm functions in a way where it breaks their large quantity of orders into multiple bits and pieces and then executes them in the market without moving the prices too much and by keeping the volume at constant levels. So this entire process will look like a tight and narrow range with normal volume, just like mentioned in the picture above.
Since Orderflow will remain more or less matched by the HFT’s trading activity, once the process is completed Price action will breakout sharply from the narrow range because of market imbalance and volatility. It’s nothing but a modified version of Richard Wyckoff’s Accumulation and Distribution phase.
Some Recent Examples of HFT Compressor Formation
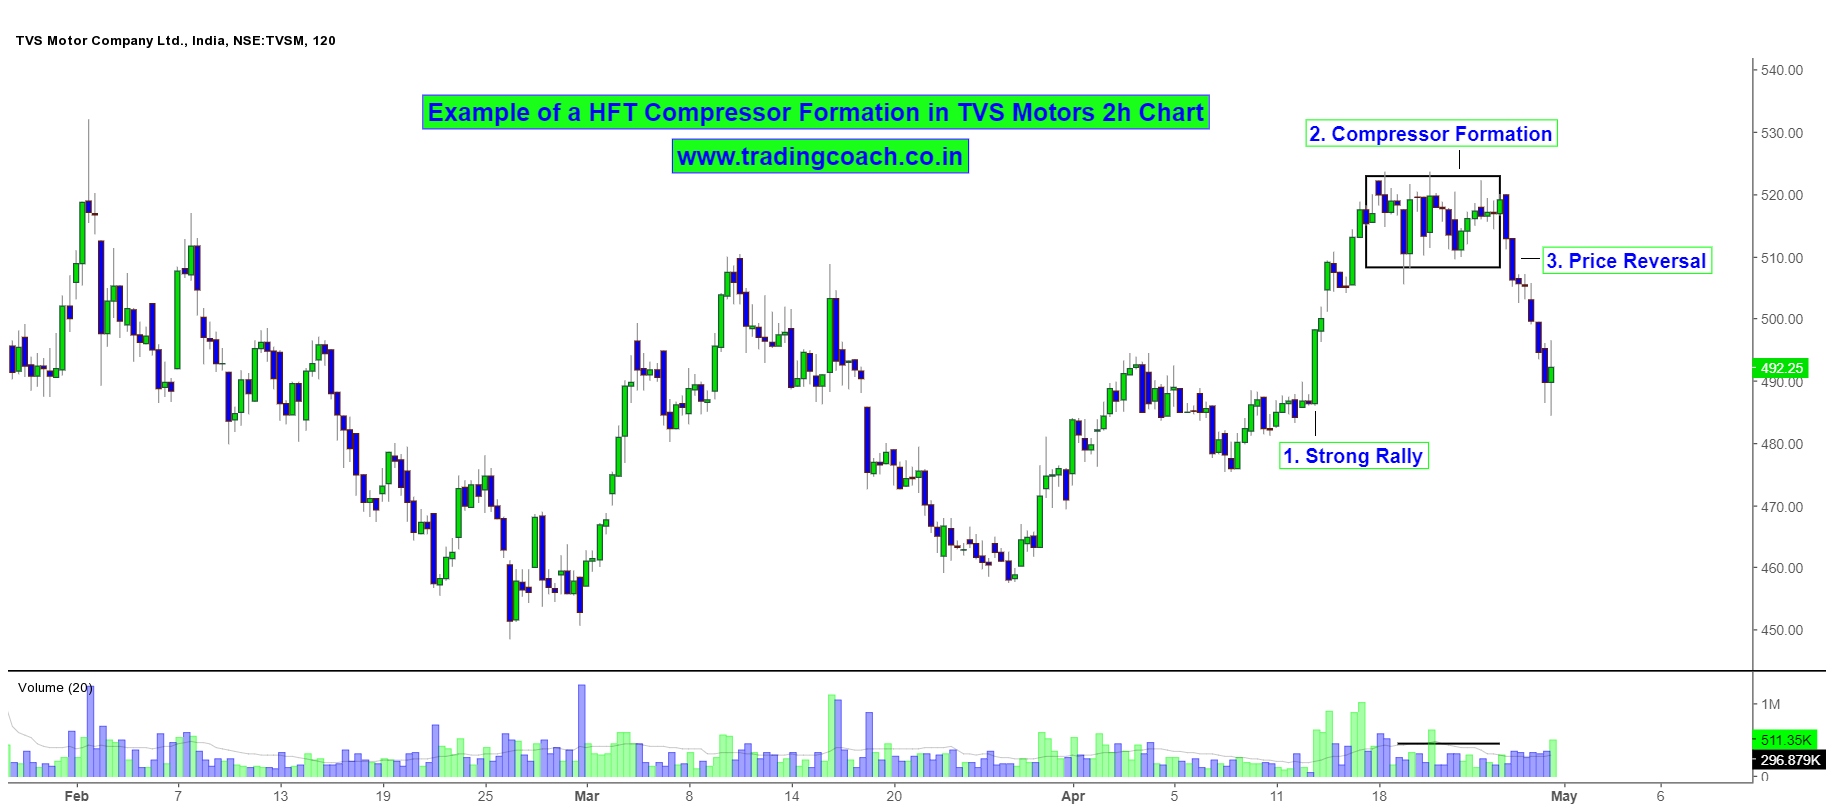
A Bearish Compressor Formation in TVS motor 2h Chart. After a strong rally from 476 to 520, price action traded in a tight narrow range between 522 – 509 for almost 8 – 9 days. If you look at the volume it initially increased during the strong rally, but later decreased to a normal level. Finally a sharp fall ensured and share prices fell from 520 to 490.
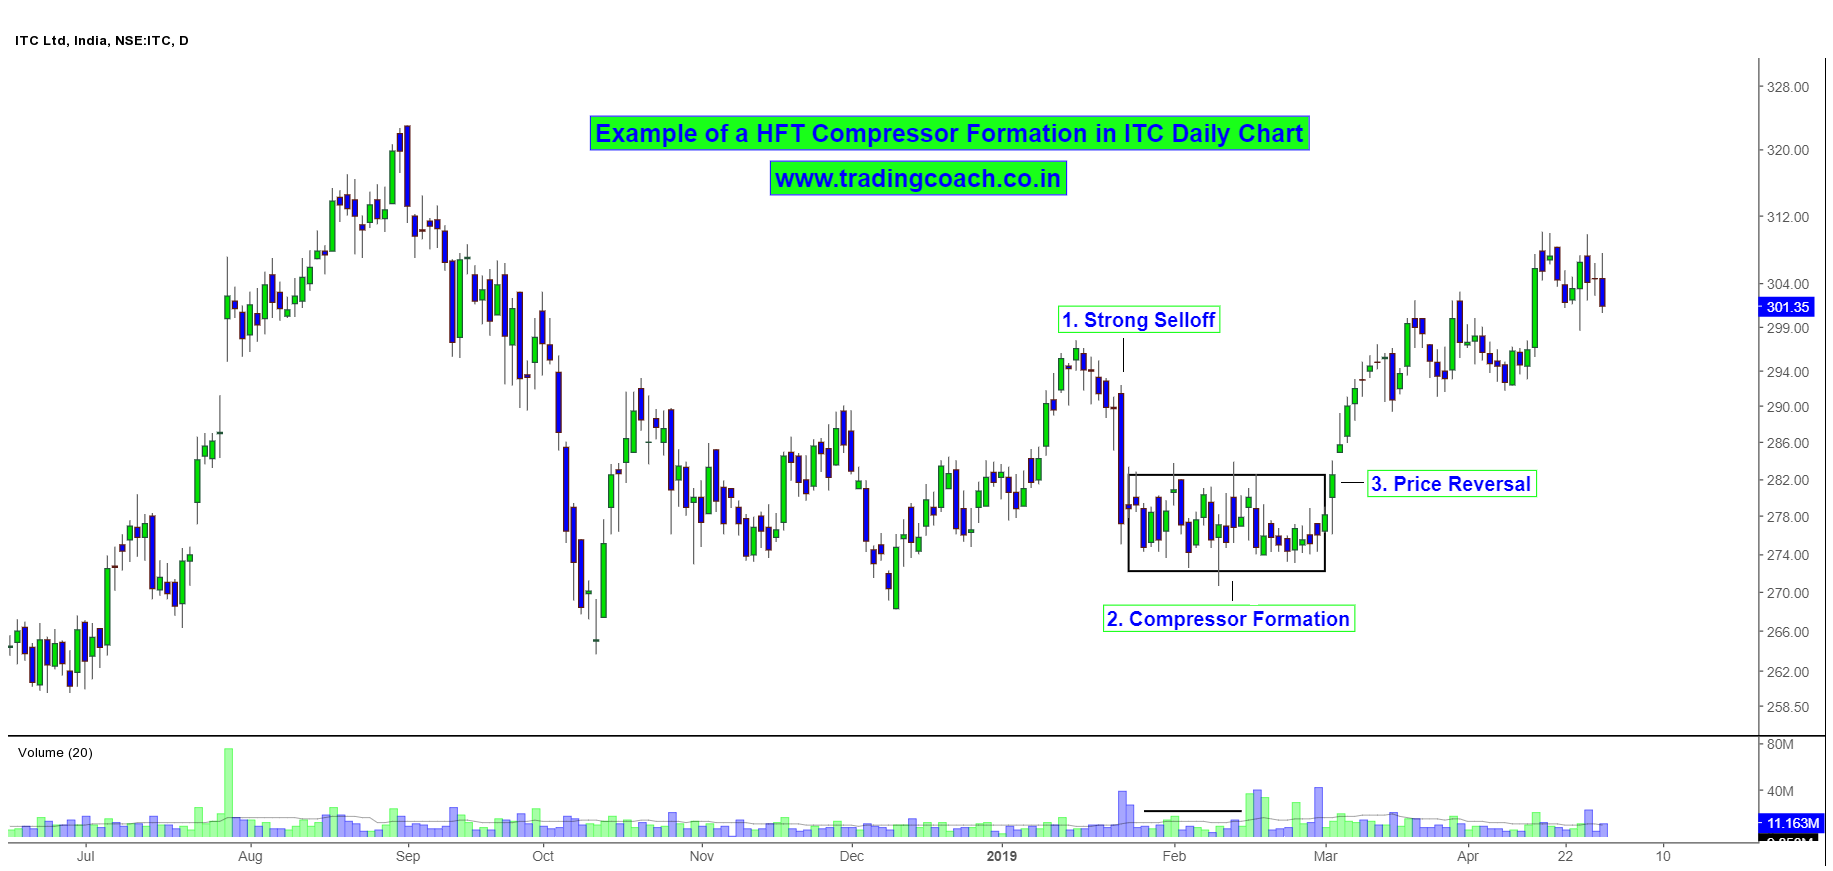
A Bullish Compressor Formation in ITC Daily Chart. After a strong selloff from 296 to 275, price action traded in a quite narrow range between 282 – 274 for almost 30 days. Then share prices reversed and rallied higher till 300. As a result of the sharp rally, market structure changed altogether to a uptrend.
Important Key Points
1. Whenever HFT’s engage in the market, their activity creates certain formations and structures on the price. Using Price Action and Volume, traders can recognize these type formations and take advantage of them.
2. Compressor is one of the HFT Trading formations – It’s a modified version of Richard Wyckoff’s Accumulation and Distribution phase.
3. The formation takes place after a strong rally or a strong selloff, in the form of a tight trading range with a normal volume. It’s created by the activity of Big money players such as Institutions and Financial firms using advanced HFT program.
4. Price Action will often reverse and move sharply after the Compressor setup. It could lead to significant gains or dramatic losses depending on which side of the trade you’re in.
Incase if you like to learn more about such High probability trading strategies, Have a look at our Advanced Premium Training Program.