Volatility is increasing once again and market indices like Nifty and Bank nifty are continuing to feed positive sentiment to investors and traders.
In my previous article, I spoke about the situation of Nifty 50, so in this content let’s take a look at the big picture outlook of Bank Nifty.
Even though prices are making new highs, we can notice the weakness in buying pressure and late buyers are likely to get trapped in the market.
Take a look at the Price Action Analysis on the 1W Chart
Bank Nifty – Price Action Trading Analysis on 1W Time frame
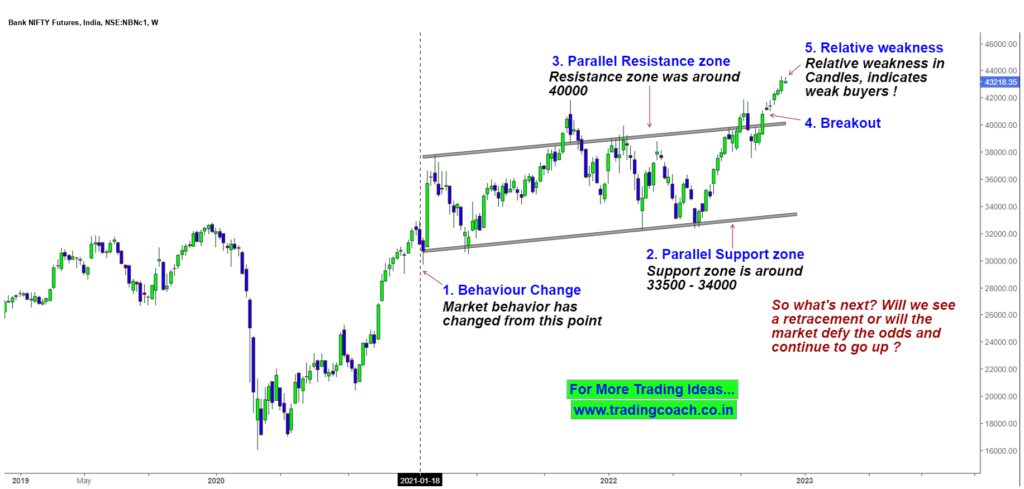
Overall, the structure is an Upward Range. Parallel Support zone is around 33500 and the Resistance zone was around 40000.
A clear Price Action Breakout of the Parallel Resistance zone indicates good momentum and Buying pressure in the market.
However, after the Breakout, candlesticks are showing signs of relative weakness, which means buyers are getting weak and late uninformed buyers are vulnerable to a shakeout.
So what’s next? Will we see a retracement in the indices or will the market defy the odds and continue to go up? What’s your outlook? Leave it in the comments…
Trading these types of market conditions requires a strong mindset. To improve your trading psychology, checkout the video given below…