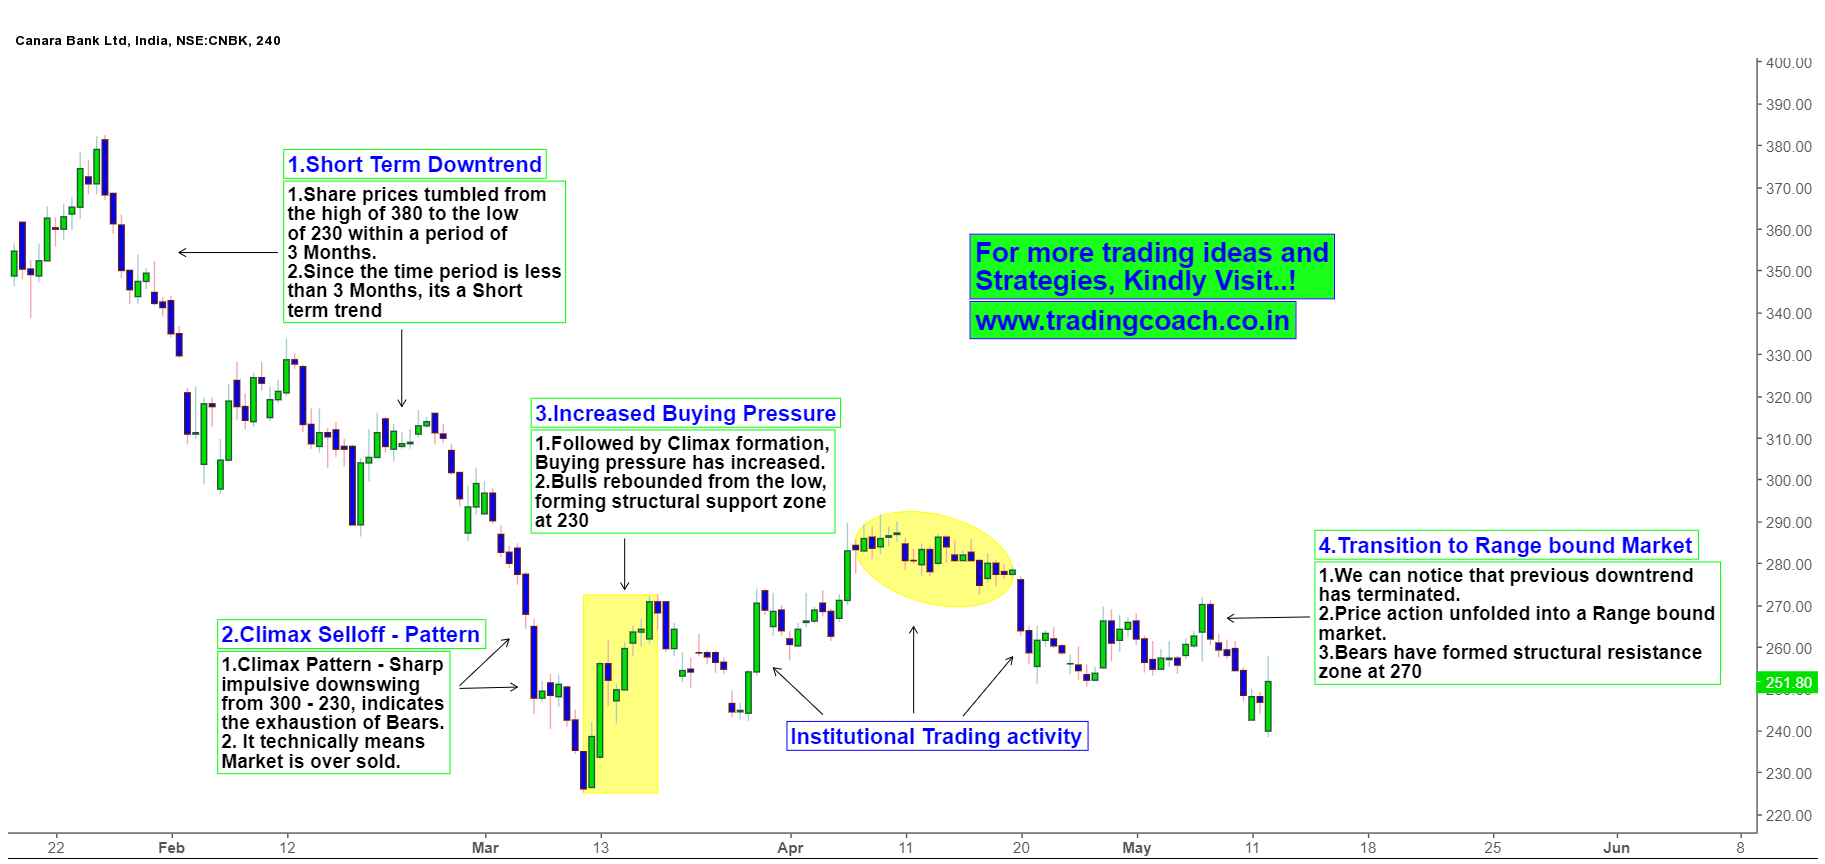
Canara Bank Share prices are experiencing a transition phase. Market structure has shifted from downtrend to Range. Through Price action we can also notice some institutional activity taking place in the stock. But the intentions of smart money players are not clear. As they say, “A Picture is worth thousand words”, Price action analysis on 4h chart of Canara Bank shows the market scenario better.
Intermediate term Price action analysis on 4h chart
During the weeks of Feb – Mid March, Stock prices were in downtrend. Prices tumbled from the high of 380 to the low of 230 within this short time. Hence based on the concept of Dow Theory, we can call this as a short-term downtrend. Trend trading strategies worked better during this phase. In the later stages of the downtrend, Price action formed a sharp impulsive trend leg known at climax Pattern. Stock Trends usually terminate after climax patterns most of the time; Canara Bank share prices followed the same route.
Buying pressure increased sharply after the formation of climax pattern. Bulls rebounded from the low, Price action formed structural support zone at 230. Prices transitioned from Downtrend to range bound structure. By closely observing the behavior, we could also notice some fragments of Institutional activity in the stock. But the intentions of these smart money players are not clear, as we witness both buying and selling pressure from institutional trades. We cover more on Institutional trading strategies in our premium course
Traders should watch the Developing price action and market structure for more clarity and insights. We may get some potential swing trading setups in Canara Bank; hence it makes sense to keep it in watch list.


