This Petrochemical Stock has rallied by more than 46% within a month. Guess what? Hardly anybody would’ve heard the name of this company!
Panama Petrochemicals is one of the leading manufacturers and exporters of petroleum specialty products in India. It goes by the ticker symbol NSE: PANAMAPET.
Recently, the stock prices have broken the long standing Parallel Resistance zone around 345. Does it have more room to go further?
Checkout the Price Action Outlook on the higher time frame chart
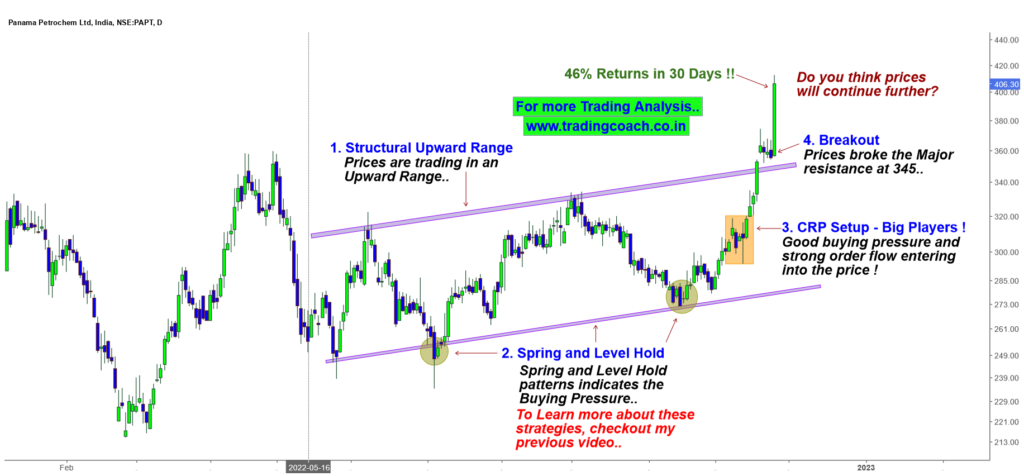
Panama Petrochemicals Price Action Trading Analysis on 1D Chart

Overall, stock prices are trading in a structural upward range. The Parallel Support zone is around 285 and the Parallel Resistance zone is at 350.
Recently, we can see a strong Breakout from the Resistance zone combined with good momentum and buying pressure
Price action also indicates the presence of Big Players and strong order flow in the stock before and after the breakout.
Will the momentum continue further? Can we expect further upside in Panama Petrochemical stock prices?
What do you think will happen next in this stock? Leave your thoughts in the comments…
To learn more about the Price Action trading strategy, checkout the video link given below.