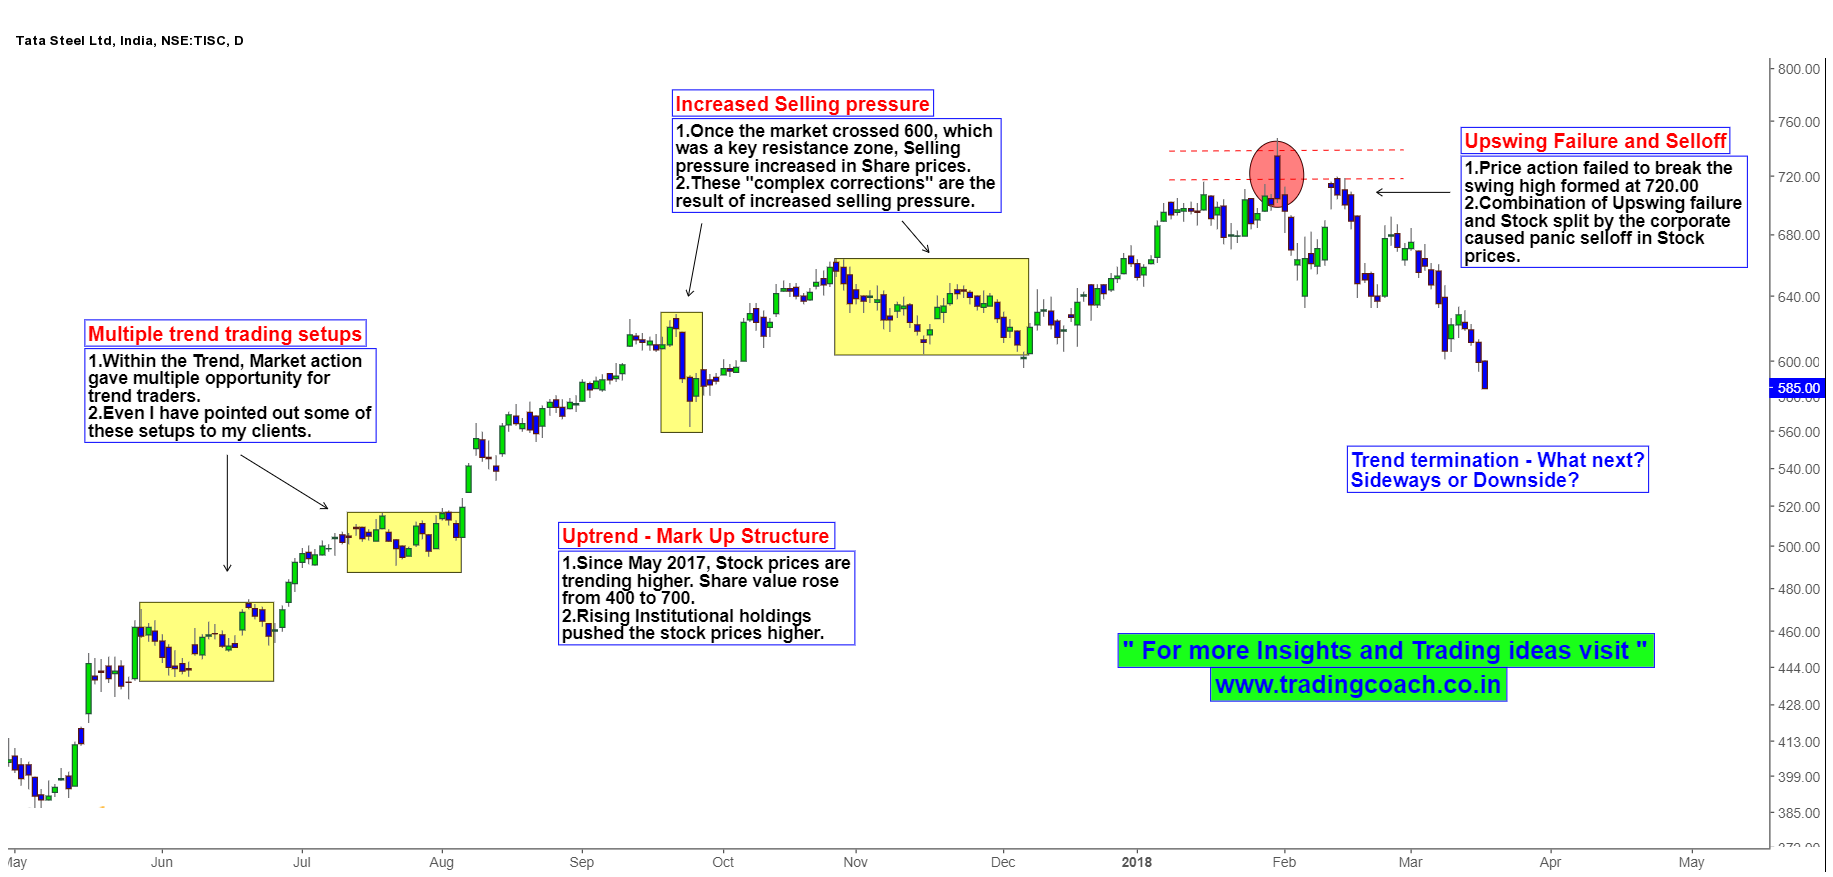
We saw a broad Price action trend in Tata steels from May 2017 to Feb 2018. Stock prices rallied from the low of 400 to the high of 700, within a period of 10 months. In the beginning of Feb, prices failed to break the swing high at 720 and tumbled sharply from there onwards. During the same time, company board announced stock split for shareholders. But it seems like recent corporate action didn’t went well with the Investors. It acted as a major catalyst for changing market sentiment and increased selling pressure on stock prices. Price action analysis on daily chart clearly reveals the Market structure and current scenario.
Tata Steel Price Action Analysis on Daily chart
The primary reason for the Trend was raising institutional holdings, especially domestic institutions such as Mutual funds. Improved earnings, rising steel prices and business growth influenced institutions to bid up Share prices. Combination of both Upswing failure at 720 and corporate action led to panic sell off in Tata steel. This selloff is an indication of bears capping the trend.
What’s likely to happen next? Will the share prices move sideways from here onwards? Would we witness an outright trend reversal? Traders should watch the developing price action for further insights and trading setups. It’s better to focus on lower time frame trades in coming days.

