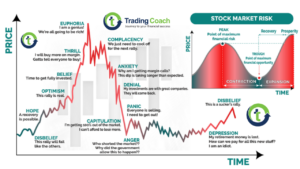
Price action Swing analysis is one of the multiple ways to analyze Price action and Market structure. In this article, I will share a simple and efficient analytical approach. This method has shown itself as reliable time and time again; these are one of my tools in understanding market structure. I have multiple strategies to stay in tune with market action, I‘ll cover most of them in my premium course. But these are my tools and techniques; you must build your own tools and techniques using my ideas and techniques. I strongly recommend my readers as well as my clients, be an independent minded. Remember, Trading is a self-directed business.
For the sake of Simplicity, Recall the meaning of Price action and Market structure in this article
PRICE ACTION SWING ANALYSIS AND MARKET STRUCTURE
Market structure refers to static movements visible in the charts. Price action creates Market structure. Market structure can be analyzed by breaking it into swings. The key elements of Market structure are pivots and swings. Price action Swing analysis should be done through combination of time and price
STRUCTURAL PIVOTS
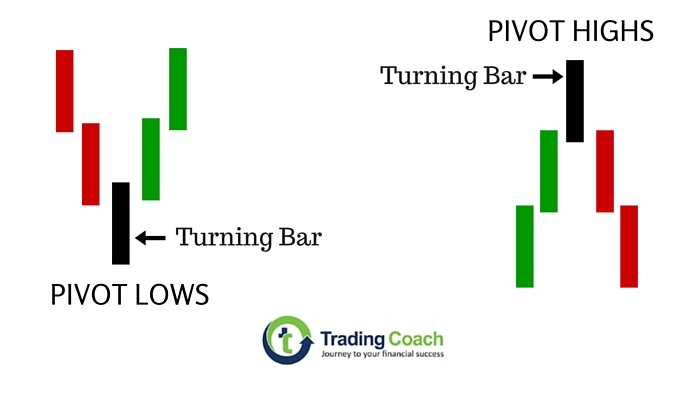
Pivot highs and lows, also known as swing highs and lows are the basic connectors of market structure. A swing high is a price bar, which forms a higher high, than the previous bar and the bar that comes after it. The high represents a potential turning point which suggests that buying pressure cannot push the price above it and considered as a minor source of resistance. A swing low is a price bar, which forms a lower low, than the previous bar and the bar that comes after it. Remember that Swing highs and Swing lows are very common in Price action.
When used as a standalone tool, Pivot highs and lows have limitations. Every major turning point comes at a swing high or swing low. This visual cue overestimates importance Swing highs and lows. When you mark every swing highs and swing lows in a chart, you’ll notice that it’ll appear randomly everywhere. The power of swing highs and lows comes from defining the market structure and the relationship it holds with Price action swing analysis.
As a Price action trader, we are not interested in every swing highs and lows. Our focus is on specific swing highs and swing lows. The swings that delineate the market structure, which give us buying and selling pressure turning points. One may call these structure in many names such as turning points, order pivots etc. For purpose of clarity and simplicity, I’ll use the name Inflective pivots.
INFLECTIVE PIVOTS
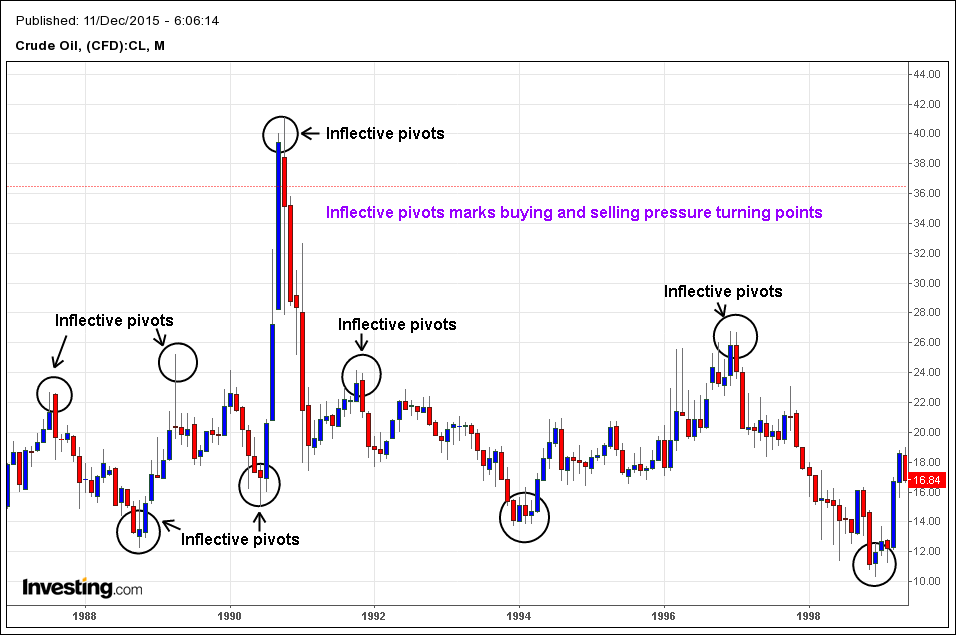
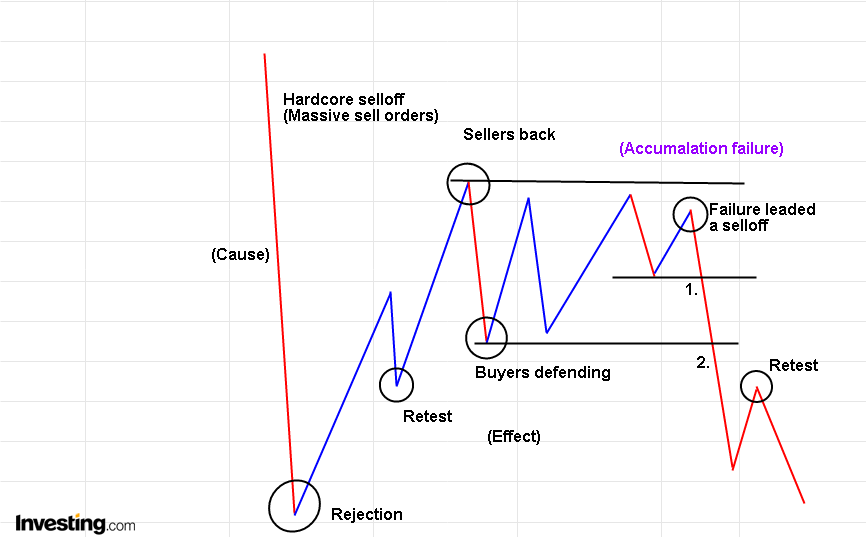
As the name suggests, Inflective pivots usually mark major inflections or large turning points. A skilled chart reader should train his eyes to see these pivots quickly. Inflective pivots are the main elements in identifying market structures. The value of these pivots exists in clearly tracing the market structure, and providing statistical representation of buying and selling pressure. They’re very easy to find with naked eye. But remember, you don’t have to fix yourself with any rules for identifying inflective pivots. Marking the inflective pivots is an intuitive skill, if you see something on your chart that resembles the inflective pivots, mark them up. The goal is identifying and defining the market structure, not to blindly follow a set of rules. Price action swing analysis is a skill, not a system.
APPLICATION AND LOGIC OF PRICE ACTION SWING ANALYSIS
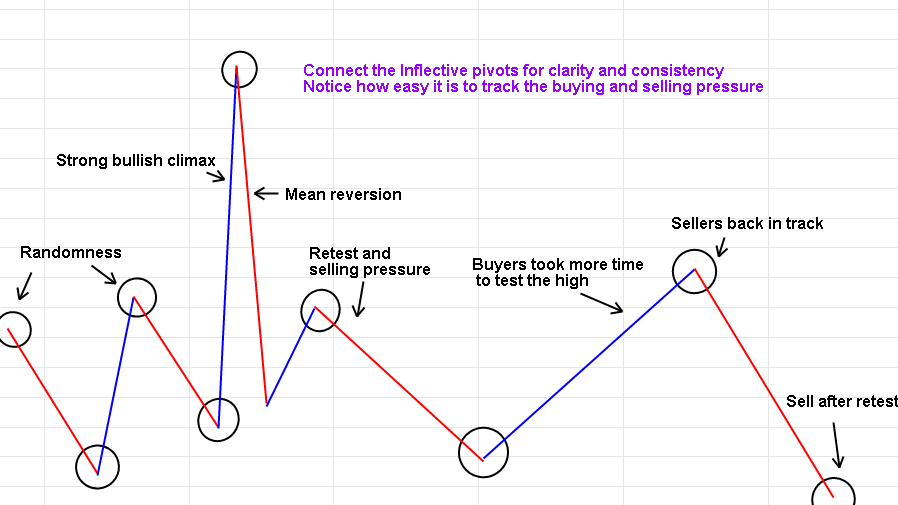
After identifying the inflective pivots, we can connect the inflective pivot highs and lows with lines to visualize the market structure. Once we connect the inflective pivots, the swings are delineated to outline the market structure with clarity. If this kind of analytical approach is new to you, then I recommend practicing it on a few charts, until it becomes intuitive and familiar. With constant practice and experience, you’ll be skilled in tracing the market structure through price action swing analysis.
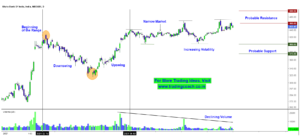
PRICE ACTION SWING ANALYSIS ON VISIBLE MARKET STRUCTURE
Now we can analyze the market structure by reading the swings. Market structure actually tells us about the buying and selling pressure in the market, it helps us to predict the imbalance in buying and selling pressure.
The core analytical concepts of price action swing analysis are,
By reading the market structure, we can find some common patterns which reflects buying and selling pressure imbalance. Cataloging these patterns, can provide foundation for most successful trading. There are common and handful of trading strategies; I cover in premium course. I would like to share few of them with my visitors. But for that, stay in tune with my blog.