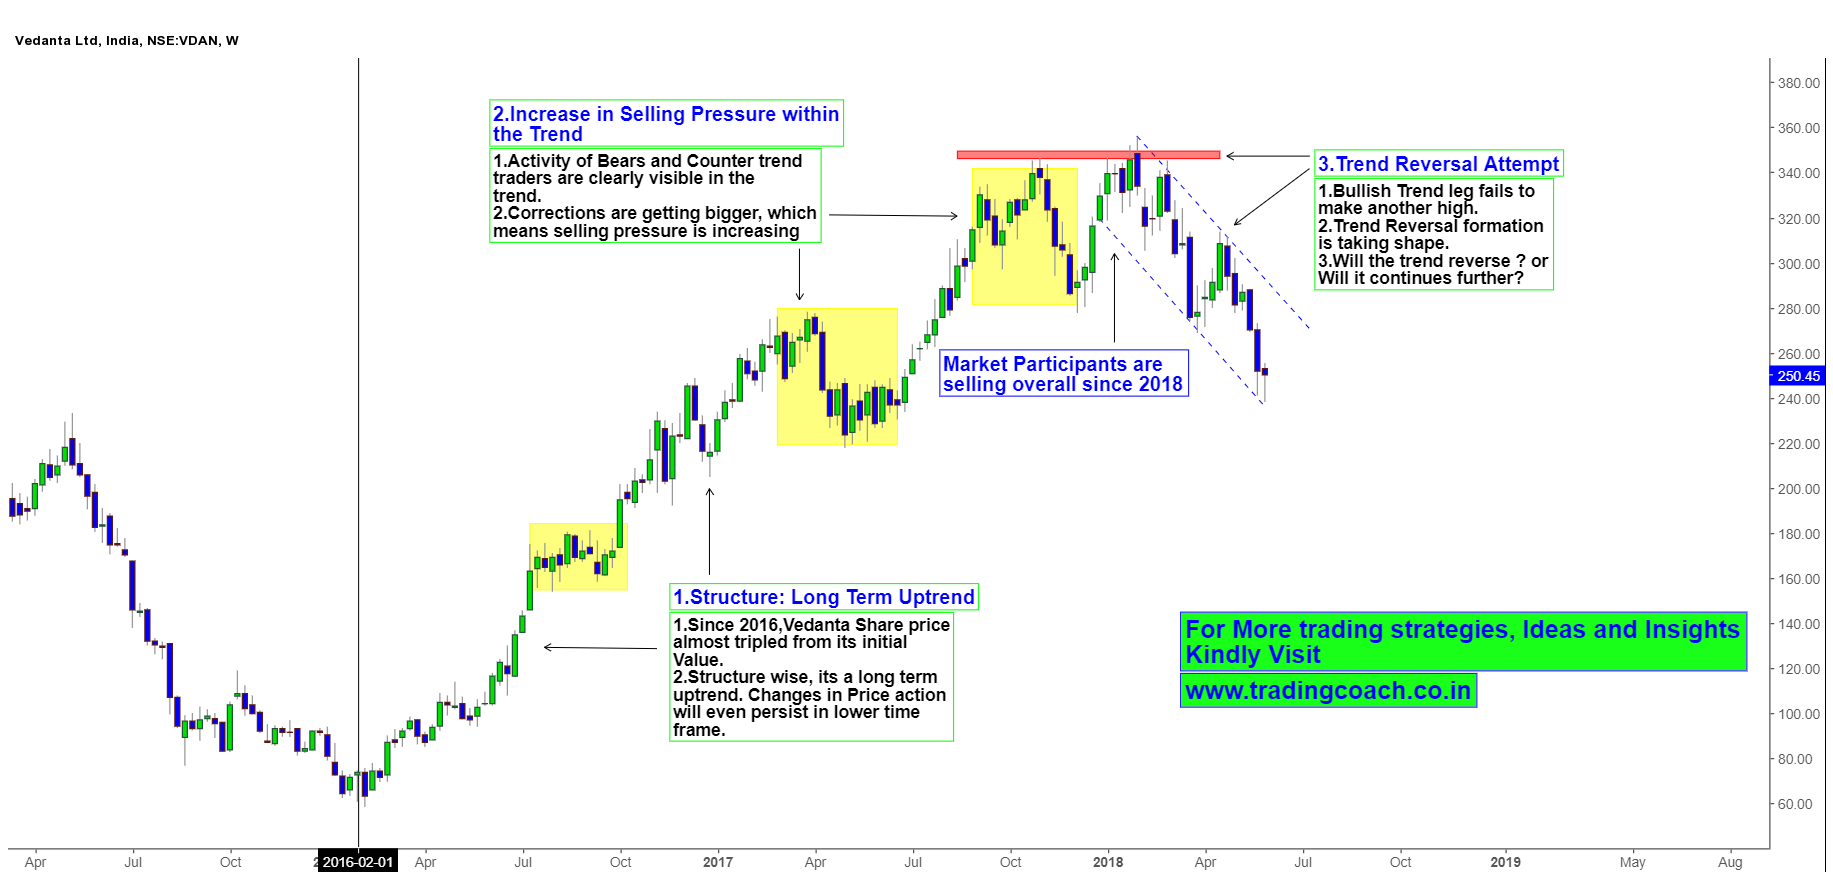
Some radical changes are taking place in Vedanta share prices. Long term trend plays a major role in Stock Analysis. Any changes in long-term trend can influence the market behavior and Price action on all time frames. That’s the case in Vedanta stock prices. Since beginning of 2018, shares tumbled from the high of 350. Price action is forming some sort of trend reversal structure on Long term trend. Weekly chart shows both the uptrend and recent price behavior clearly.
Vedanta Price Action Analysis on Long term Trend in weekly chart
Even when Fundamentals are not clear, Stock prices tend to move with some hidden motivations and Interests. Having a proper knowledge on Price action – chart reading is one of the best ways to understand Market psychology and spot market turning points. Vedanta Shares started to slip from Jan 2018, seems like some prominent insiders sold the stock even before Sterlite copper plant issues popped up. Once the news become public, selloff intensified and Investors liquidated their positions in Panic.
If we look at the weekly chart, it’s easy to understand the Market activity from a structural context and make sense of Market behavior. A Trend reversal attempt is taking place after an extended uptrend and fundamentals are driving the market prices. We refer them as trend reversal attempts because these types of price action often lead to trend terminating. What might happen this time? Will the trend reverse or would it continue further? Observe the Developing price action and trade accordingly. Also remember that this is a long-term trend, so share prices can become highly volatile, so think about Risk management before initiating any trades.


