The Indian Rupee is one of the worst performers in Asian currency this calendar year with recording depreciation of 3.55%. It is attributed to over-supply of Bonds and increasing government deficit. Macro economic factors and global uncertainty is casting a shadow on INR and influencing bearish sentiment. Read About USD/INR Long term analysis here…
Price action points out some important factors in USD/INR chart and gives further clues on what currency traders should watch. One important factor is to notice that USD/INR is in long-term uptrend, which also means that INR is in long-term depreciation against USD. From the beginning of Jan 15 2016 till early February, Price action went into deep short-term, range trading environment.
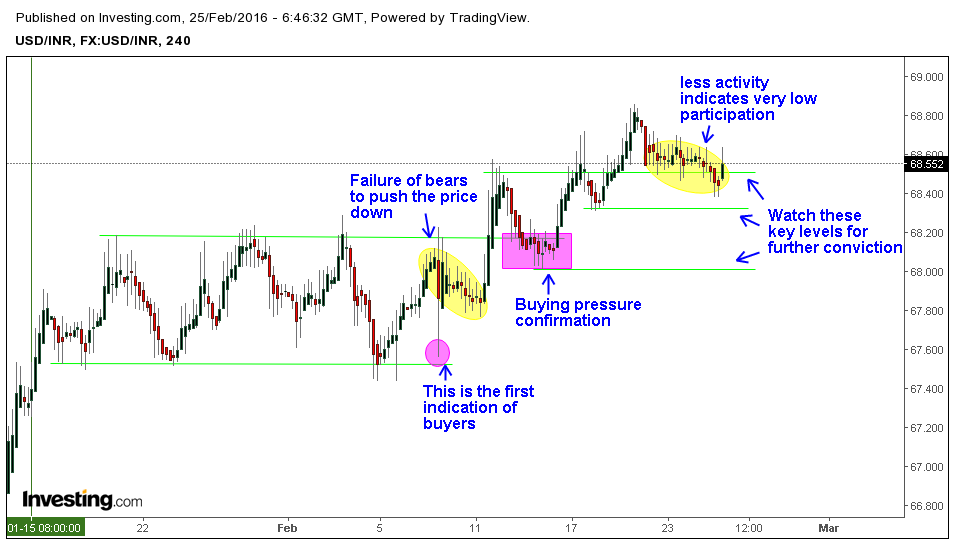
Real Breakthrough happened, when price action tested important resistance level at 68.19 for the fifth time around February 9 2016. When selling pressure was unable to sustain the momentum, the strength of buying pressure to break the resistance level, became clear. Failure of bears to push the price downside and sharp rejection of candlestick, after testing support level are indications of bullish strength and force.(Look at the chart)
After the breakout of resistance, price action retested the key level 68.20, which later became support zone. This became another conformation for buying pressure to sustain the upside movement, prices rose until 68.80, just 20 pips below the radar level 69.00. Later around February 19 2016 USD/INR started corrections, as usual driven by low participation and less activity. Now the price action is testing previous support level 68.50.
Technically there are more supporting factors for bulls to rise above 69.00, which of course, mean further depreciation for Indian Rupee. Nonetheless one should watch price action clues and further confirmation on the strength of buying pressure. Incase, if Price action fails to give any indication of buying pressure, one should stay sidelines till clear picture emerges. Traders should focus on key support levels 68.50, 68.30 and 68.00. In terms of resistance, keep an eye on 68.70, 68.85 and finally 69.00 which is of course, a radar level.