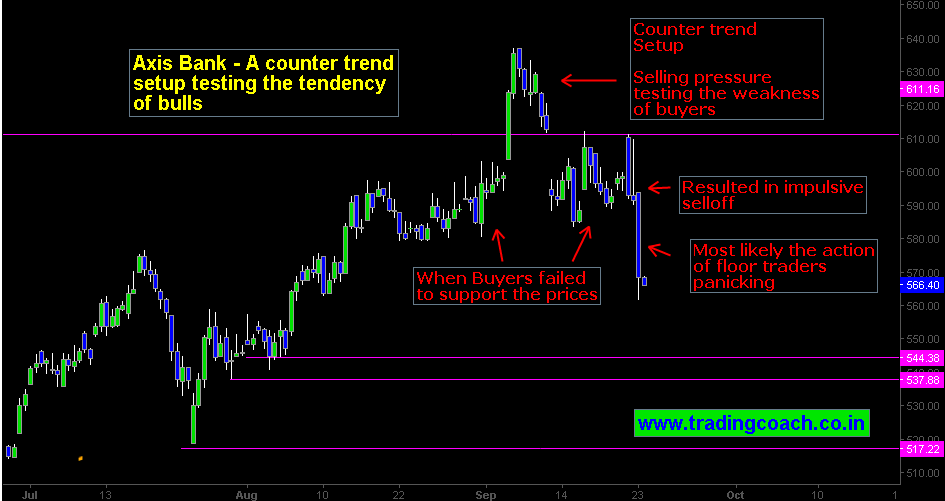
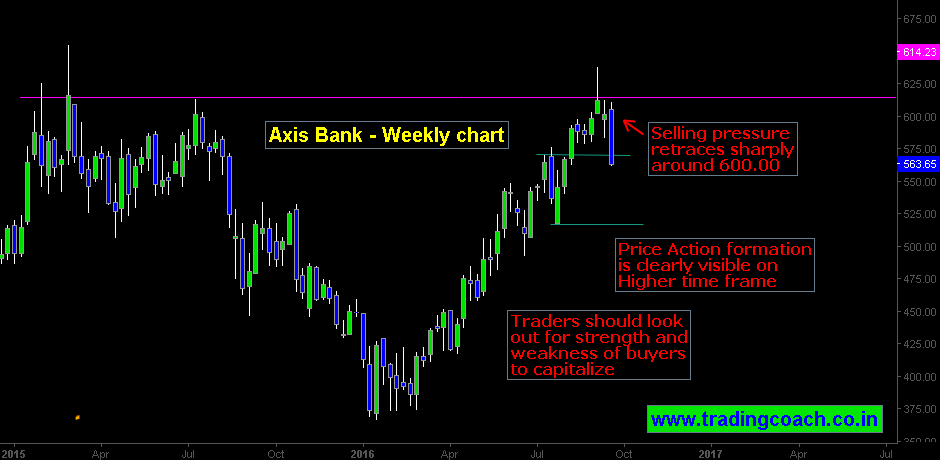
My previous article on Axis bank pointed the possibilities of a correction, after a stellar rise in share prices. Axis bank started trending up from March. Price value per share rose from 375.00 to 600.00. Mostly the trend is attributed to increased weightage on MSCI Emerging market index. Price action has formed a counter trend setup which might act as Trend tester. Market will test the tendency of buyers around support zones to determine the momentum of buying pressure. Next support zone exist at 550.00. Traders must keep an eye on the stock – it might offer high probabilitical trading setups.
Price Action Retraces And Forms Counter Trend Trading Setup
We can spot symmetrical market structure on Daily and weekly chart of Axis bank. After breaking the key resistance level at 610.00, buying pressure couldn’t sustain above it. Prices soon reverted back to round number zone 600.00. Market consolidated tightly around 600.00 during the period of September 14 -23. When buyers didn’t support the prices, shares sold off impulsively. Technically counter trend setups happen because of liquidation and position adjustments, if the sell off continues then prices might turn into a new trend. Price bounces or strong rallies will result in either consolidation or continuation of earlier trend. Selling pressure is testing the threshold point of bulls. It is necessary to watch buyers reaction to get a perspective of Market sentiment.
Weekly chart highlights the structure as well as the resistance zone at 600.00. Prices retraced sharply after failing to sustain above the resistance zone. Selling bias persisting on Axis bank, traders should observe the strength and weakness of buyers to capitalize.


