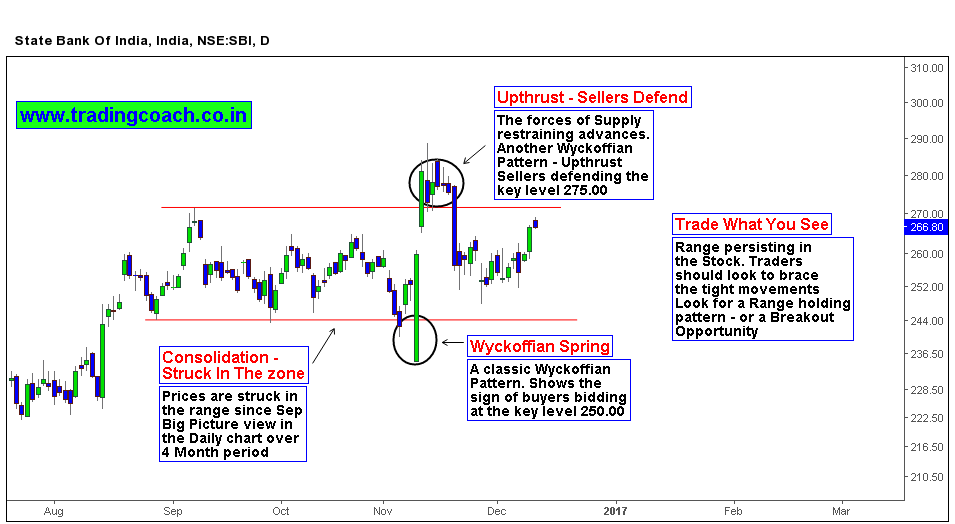
As we all know, SBI share prices are struck in consolidation 240 – 280.00. The range is persisting since August; I updated multiple times back then to look for a range trading opportunity. It can be either range breakout opportunity or Range holding opportunity. Intraday traders could’ve missed it, because they don’t consider the larger time frame price action. Having a Big picture view is always worth it. Looking at the daily chart, we can see how prices ran erratic within the tight boundaries.
In the coming days, we will see a lot of fundamental drivers on both domestic and Global scale. Important economic indicators, reports will be on the table. The thesis and trading plan is still the same, Gauge the price action and look for a breakout trade or trade within the range. Holidays are just around the corner which can potentially impact the liquidity, so be aware of that risk as well. Look at the chart for complete understanding of Price action.(I cover Chart analysis, Price action trading in my premium course.) If the range bound structure continues, we can use option straddles to make profits.
